This indicator reports on the development and implementation of some key plans for climate change mitigation, as well as progress in achieving Ontario’s Climate Change Action Plan target to reduce greenhouse gas (GHG) emissions by 6% below 1990 levels by 2018.
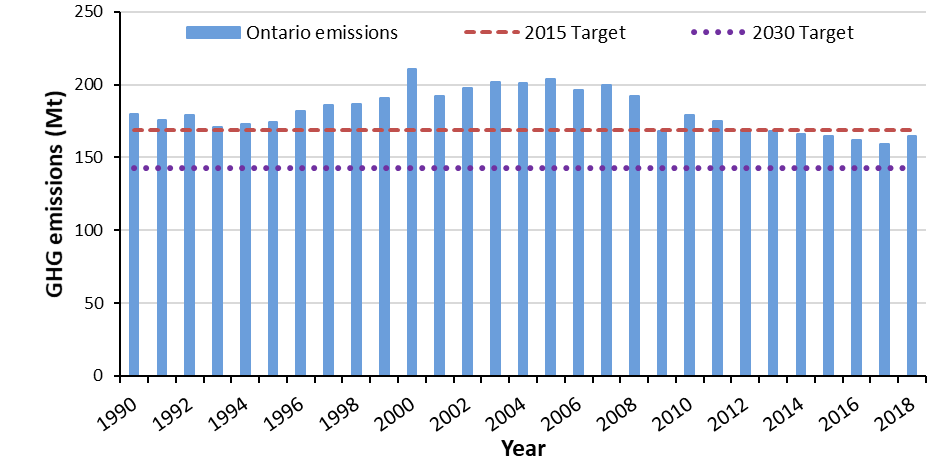
Figure 1. Greenhouse gas emission summary for Ontario 1990–2018 with Ontario Biodiversity Strategy emission target for 2015 and Ontario’s target for 2030 of 30% below 2005 levels (Sources: Environment and Climate Change Canada 2020 NIR report and 2018 Made-in-Ontario Environment Plan).
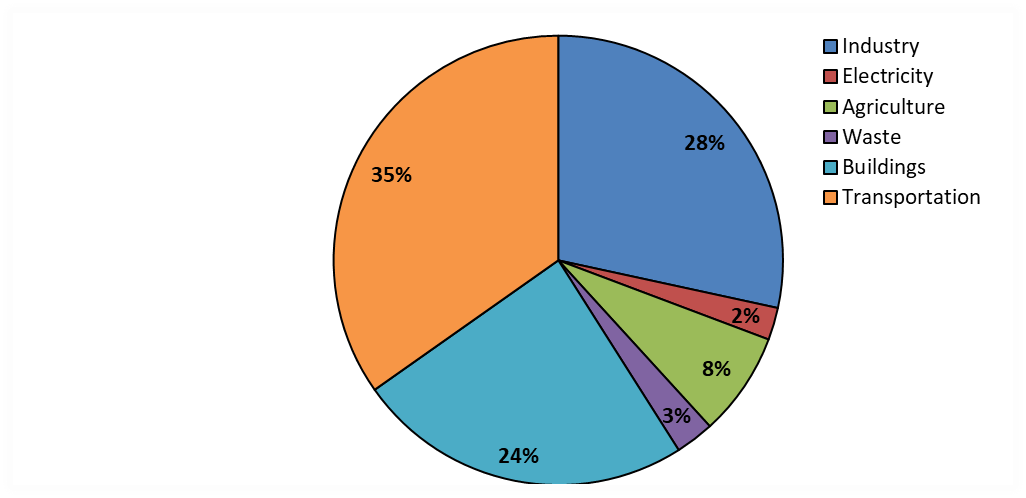
Figure 2. Greenhouse gas emissions in Ontario by sector 2018. Sectors indicated in the legend are represented in the pie chart in clockwise order, starting with Industry in the top right quadrant (Source: Environment and Climate Change Canada 2020).
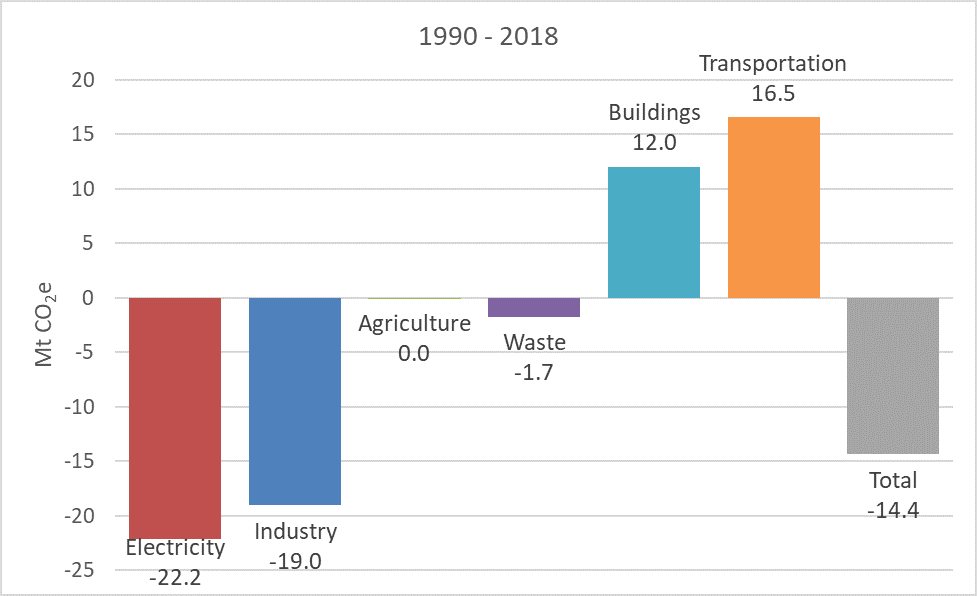
Figure 3. Changes in Ontario’s greenhouse gas emissions by Sector 1990–2018. (Source: Environment and Climate Change Canada 2020 NIR report)
Status:
- Since the OBS 2015 target was established, the province has iteratively developed and implemented policies and programs to directly or indirectly reduce GHG emissions. Some of the policies and programs that have been enacted since the establishment of the OBS target include: Go Green: Ontario’s Climate Change Action Plan (2007)*; The Big Move Transportation Plan (2008); Green Energy Act (2009); Building Code Amendments (2020); Ending Coal for Cleaner Air Act (2015)*; Ontario’s Climate Change Strategy (2015)*; Ontario’s 2016-2020 Climate Change Action Plan (2016)*; Climate Change Mitigation and Low-carbon Economy Act (2016)*; as well as a number of supporting plans at the provincial, regional and municipal levels. The Cap and Trade Cancellation Act (CTCA), 2018 repealed the Climate Change Mitigation and Low Carbon Economy Act, 2016. The CTCA triggered a requirement for the minister to prepare a climate change plan, which is embedded in the province’s 2018 Environment Plan (OMECP 2018).
*note: these policies/programs have been repealed
- GHG emissions in Ontario grew from 1990 to the early 2000s, then stabilized and declined in recent years. Since 1990, total annual emissions in Ontario have declined by approximately 8%, or 14 million tonnes (Mt). The greatest reductions in emissions during that period were in the electricity (22 Mt or 85% reduction) and industry (19 Mt or 29%) sectors. The large reduction in GHG emissions from the electricity sector is attributable to the phasing out of coal-fired electricity generation in the province, while the reduction in the industrial sector is attributable to improvements in efficiency and structural changes in the sector.
- Since 2015 total GHG emissions have continued to decline in Ontario; however, emissions in 2018 increased in part due to a colder winter, manufacturing, road traffic etc. Emissions from certain sectors, including the transportation and building sectors continue to increase.
- In 2015 Ontario’s total GHG emissions were 165 Mt. The Ontario Biodiversity Strategy 2015 target to reduce GHG emissions by 6% below 1990 levels was achieved (in 2015, Ontario’s total GHG emissions were 165 Mt compared to 177 Mt in 1990).
Information about GHG emissions in Ontario can be found in Environment and Climate Change Canada’s National Inventory Report 1990–2018: Greenhouse Gases Sources and Sinks (2020). Canada’s National Inventory Report is prepared and submitted annually to the United Nations Framework Convention on Climate Change (UNFCCC). The inventory emission estimates are reported by totals aggregated at the provincial and sectoral levels. Some of the GHGs reported on include: carbon dioxide (CO2), methane (CH4), nitrous oxide (N2O), sulphur hexafluoride (SF6), perfluorocarbons (PFCs), hydrofluorocarbons (HFCs) and nitrogen trifluoride (NF3).
Environment and Climate Change Canada is responsible for the preparation and submission of the National Inventory Report to UNFCCC. Data for GHG emissions have been calculated annually since 1990. Emissions data for Ontario were categorized into the following six sectors: transportation, industry, buildings, electricity, agriculture and waste (Table 1). Emission data for Ontario from 1990 to 2018 were plotted against the OBS target for 2015 and Ontario’s 2030 emission target (Figure 1). Planned emission reductions in 2030 by sector can be found in Ontario’s Environment Plan (OMECP 2018). The proportions of GHG emissions by sector for 2018, as well as the percent change in GHG emissions by sector between 2009 and 2018 are presented in Figures 2 and 3.
Table 1. Sector descriptions for sources of greenhouse gas emissions (Source: OMOECC 2014).
| Sector |
Sources of greenhouse gas emissions
|
| Transportation |
The combustion of fossil fuels such as diesel, gasoline and propane by passenger and commercial vehicles on and off roads, as well as rail and Ontario’s share of domestic marine and air travel. |
| Industry |
Some industrial processes and stationary combustion of fossil fuels such as coke, natural gas and coal used in mining; pipelines; construction; greenhouses; production of cement, iron and steel, chemicals, paper and wood products; and other manufacturing. |
| Buildings |
The combustion of fossil fuels such as natural gas in residential, commercial and institutional buildings for space and water heating. |
| Electricity |
Generating electricity and heat by electric utilities using fossil fuels such as natural gas. |
| Agriculture |
Enteric fermentation, manure management and fertilizer application. |
| Waste |
Solid waste disposal on land, wastewater handling and waste incineration. |
Web Links:
National inventory report: greenhouse gas sources and sinks in Canada. http://www.publications.gc.ca/site/eng/9.506002/publication.html
Ontario Ministry of the Environment, Conservation and Parks. https://www.ontario.ca/page/ministry-environment-conservation-parks
Ontario Ministry of Natural Resources and Forestry http://www.ontario.ca/ministry-natural-resources-forestry
United Nations Framework Convention on Climate Change https://unfccc.int/process-and-meetings/transparency-and-reporting/reporting-and-review-under-the-convention/greenhouse-gas-inventories-annex-i-parties/national-inventory-submissions-2019
Environmental plan https://www.ontario.ca/page/made-in-ontario-environment-plan http://unfccc.int/national_reports/annex_i_ghg_inventories/national_inventories_submissions/items/8108.php
References:
Bellard, C., C. Bertelsmeier, P. Leadley, W. Thuiller, and F. Courchamp. 2012. Impacts of climate change on future biodiversity. Ecology Letters 15:365-367.
Environment and Climate Change Canada. (2019). National Inventory Report 1990–2017: Greenhouse gas sources and sinks in Canada.[Available at: http://www.publications.gc.ca/site/eng/9.506002/publication.html]
IPCC. 2014. Summary for policymakers. pp. 1-32 In [Field, C.B., V.R. Barros, D.J. Dokken, K.J. Mach, M.D. Mastrandrea, T.E. Bilir, M. Chatterjee, K.L. Ebi, Y.O. Estrada, R.C. Genova, B. Girma, E.S. Kissel, A.N. Levy, S. MacCracken, P.R. Mastrandrea, and L.L. White (eds.)]Climate change 2014: impacts, adaptation, and vulnerability. Part A: Global and sectoral aspects. Contribution of Working Group II to the Fifth Assessment Report of the Intergovernmental Panel on Climate Change. Cambridge University Press, Cambridge, U.K.
Ontario Biodiversity Council. 2011. Ontario’s biodiversity strategy, 2011: renewing our commitment to protecting what sustains us. Ontario Biodiversity Council, Peterborough, ON.
Ontario Ministry of the Environment (OMOE). 2007. Go green: Ontario’s action plan on climate change. Queen’s Printer for Ontario, Toronto, ON.
Ontario Ministry of the Environment and Climate Change (OMOECC). 2014. Ontario’s Climate Change Update 2014. Queen’s Printer for Ontario, Toronto, ON.
Ontario Ministry of the Environment and Climate Change (OMOECC). 2016. Ontario’s Five Year Climate Change Action Plan 2016-2020. Queen’s Printer for Ontario, Toronto, ON.
Ontario Ministry of the Environment, Conservation and Parks (MECP). 2018. Preserving and Protecting our Environment for Future Generations: A Made-in-Ontario Environment Plan. Queen’s Printer for Ontario.
