This indicator uses information on Walleye populations from the Broad-Scale Monitoring Program to assess the level of fishing stress on Walleye across Ontario as an indicator of sustainable management. Information on estimated recreational Walleye harvest and fishing intensity from the 2010 Survey of Recreational Fishing in Canada is used to supplement the data from the Broad-Scale Monitoring Program.
Stress Associated With Fishing Mortality

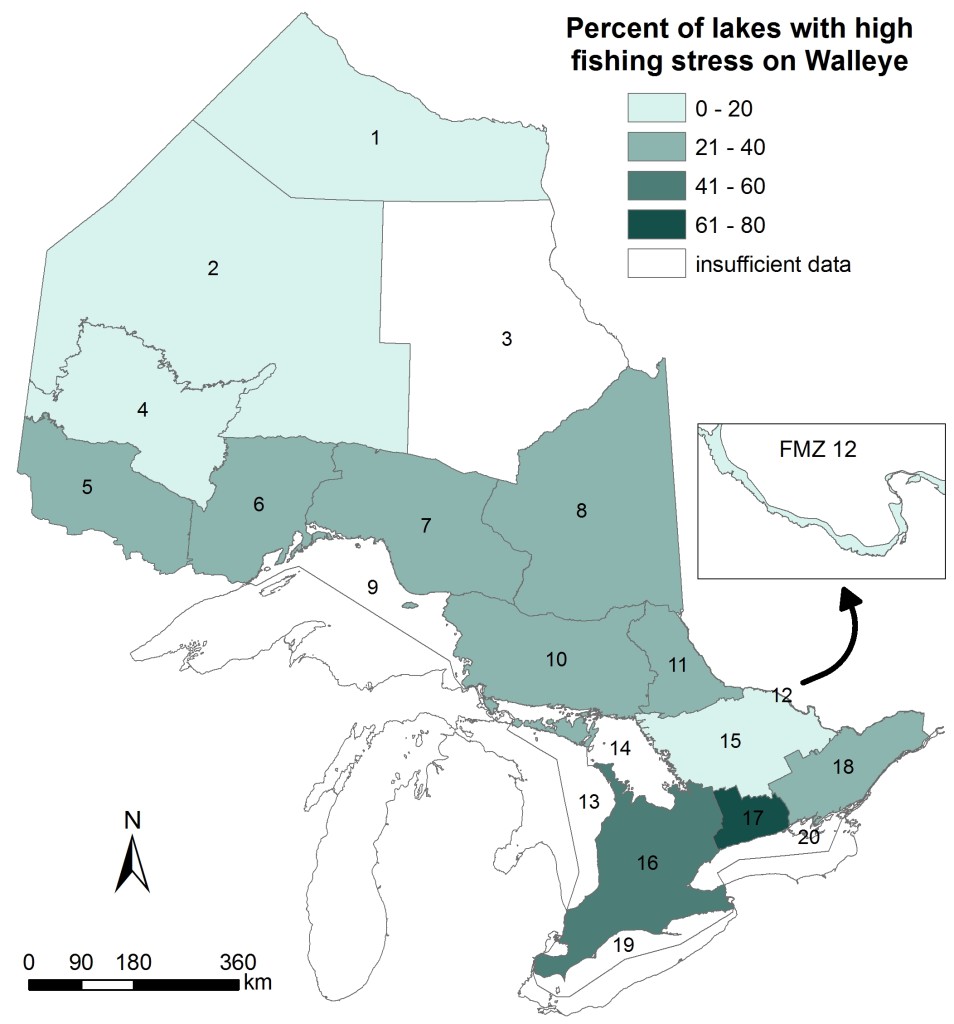
Figure 1. Proportion of sampled Walleye lakes in each Fisheries Management Zone with high fishing stress based on first 5-year cycle of Broad-scale Monitoring (Lakes with estimated Walleye fishing mortality equal to or greater than natural mortality were assessed as having high fishing stress on Walleye).
Figure 1. Proportion of sampled Walleye lakes in each Fisheries Management Zone with high fishing stress based on first 5-year cycle of Broad-scale Monitoring (Lakes with estimated Walleye fishing mortality equal to or greater than natural mortality were assessed as having high fishing stress on Walleye).
Status:
- Ninety-six of 374 Walleye lakes (26%) sampled in the first 5-year cycle of Ontario’s Broad-scale Monitoring Program (2008-2012) were assessed as having high fishing stress on their Walleye populations based on estimates of fishing mortality.
- Fisheries Management Zones 17 in southern Ontario’s Mixedwood Plains Ecozone has the greatest proportion of sampled lakes with high fishing stress on Walleye (63% of sampled lakes).
- Fisheries Management Zones in the Ontario Shield and Hudson Bay Lowlands ecozones have a relatively small proportion of sampled lakes with high fishing stress on walleye (all < 34%). None of the sampled lakes from Fisheries Management Zones 1 and 2 in the Far North and Zone 12 in the southern Ontario Shield Ecozone were assessed as having high fishing stress on Walleye.
Harvest and Fishing Intensity
A)

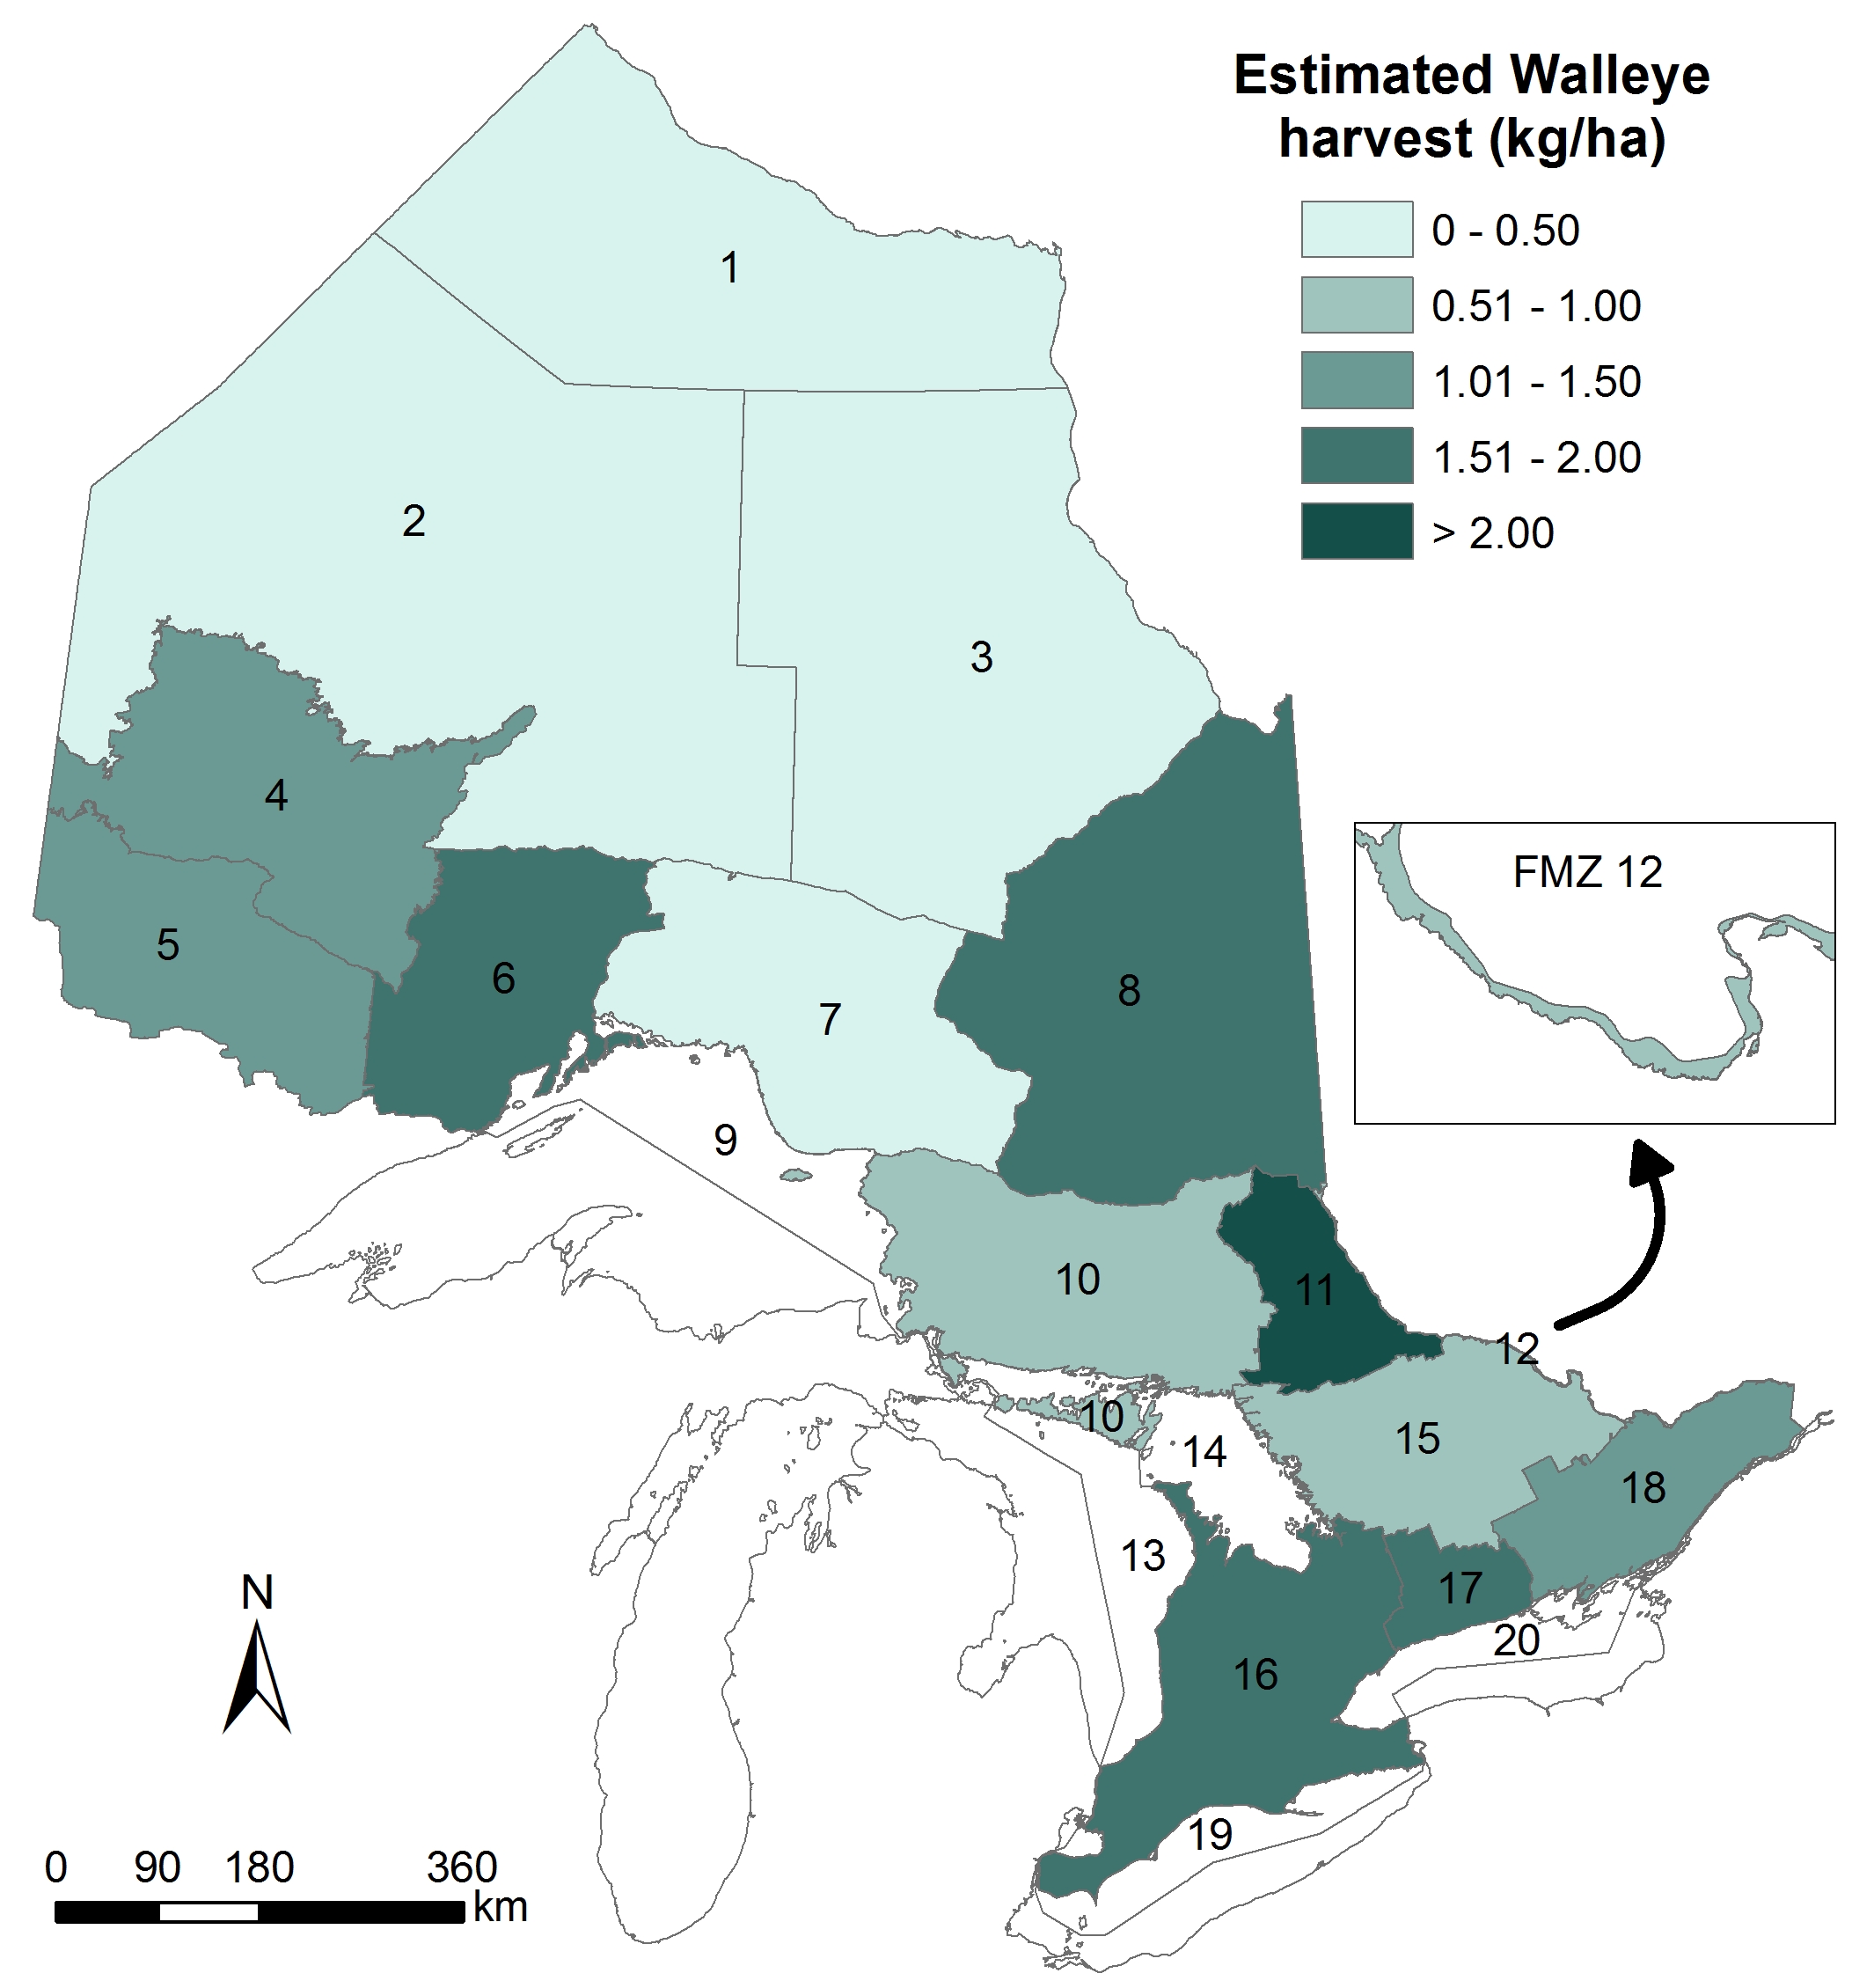
Figure 2. A) Estimated recreational fishing harvest of Walleye standardized by lake area (kg/ha) for lakes in inland Fisheries Management Zones in Ontario;
B)

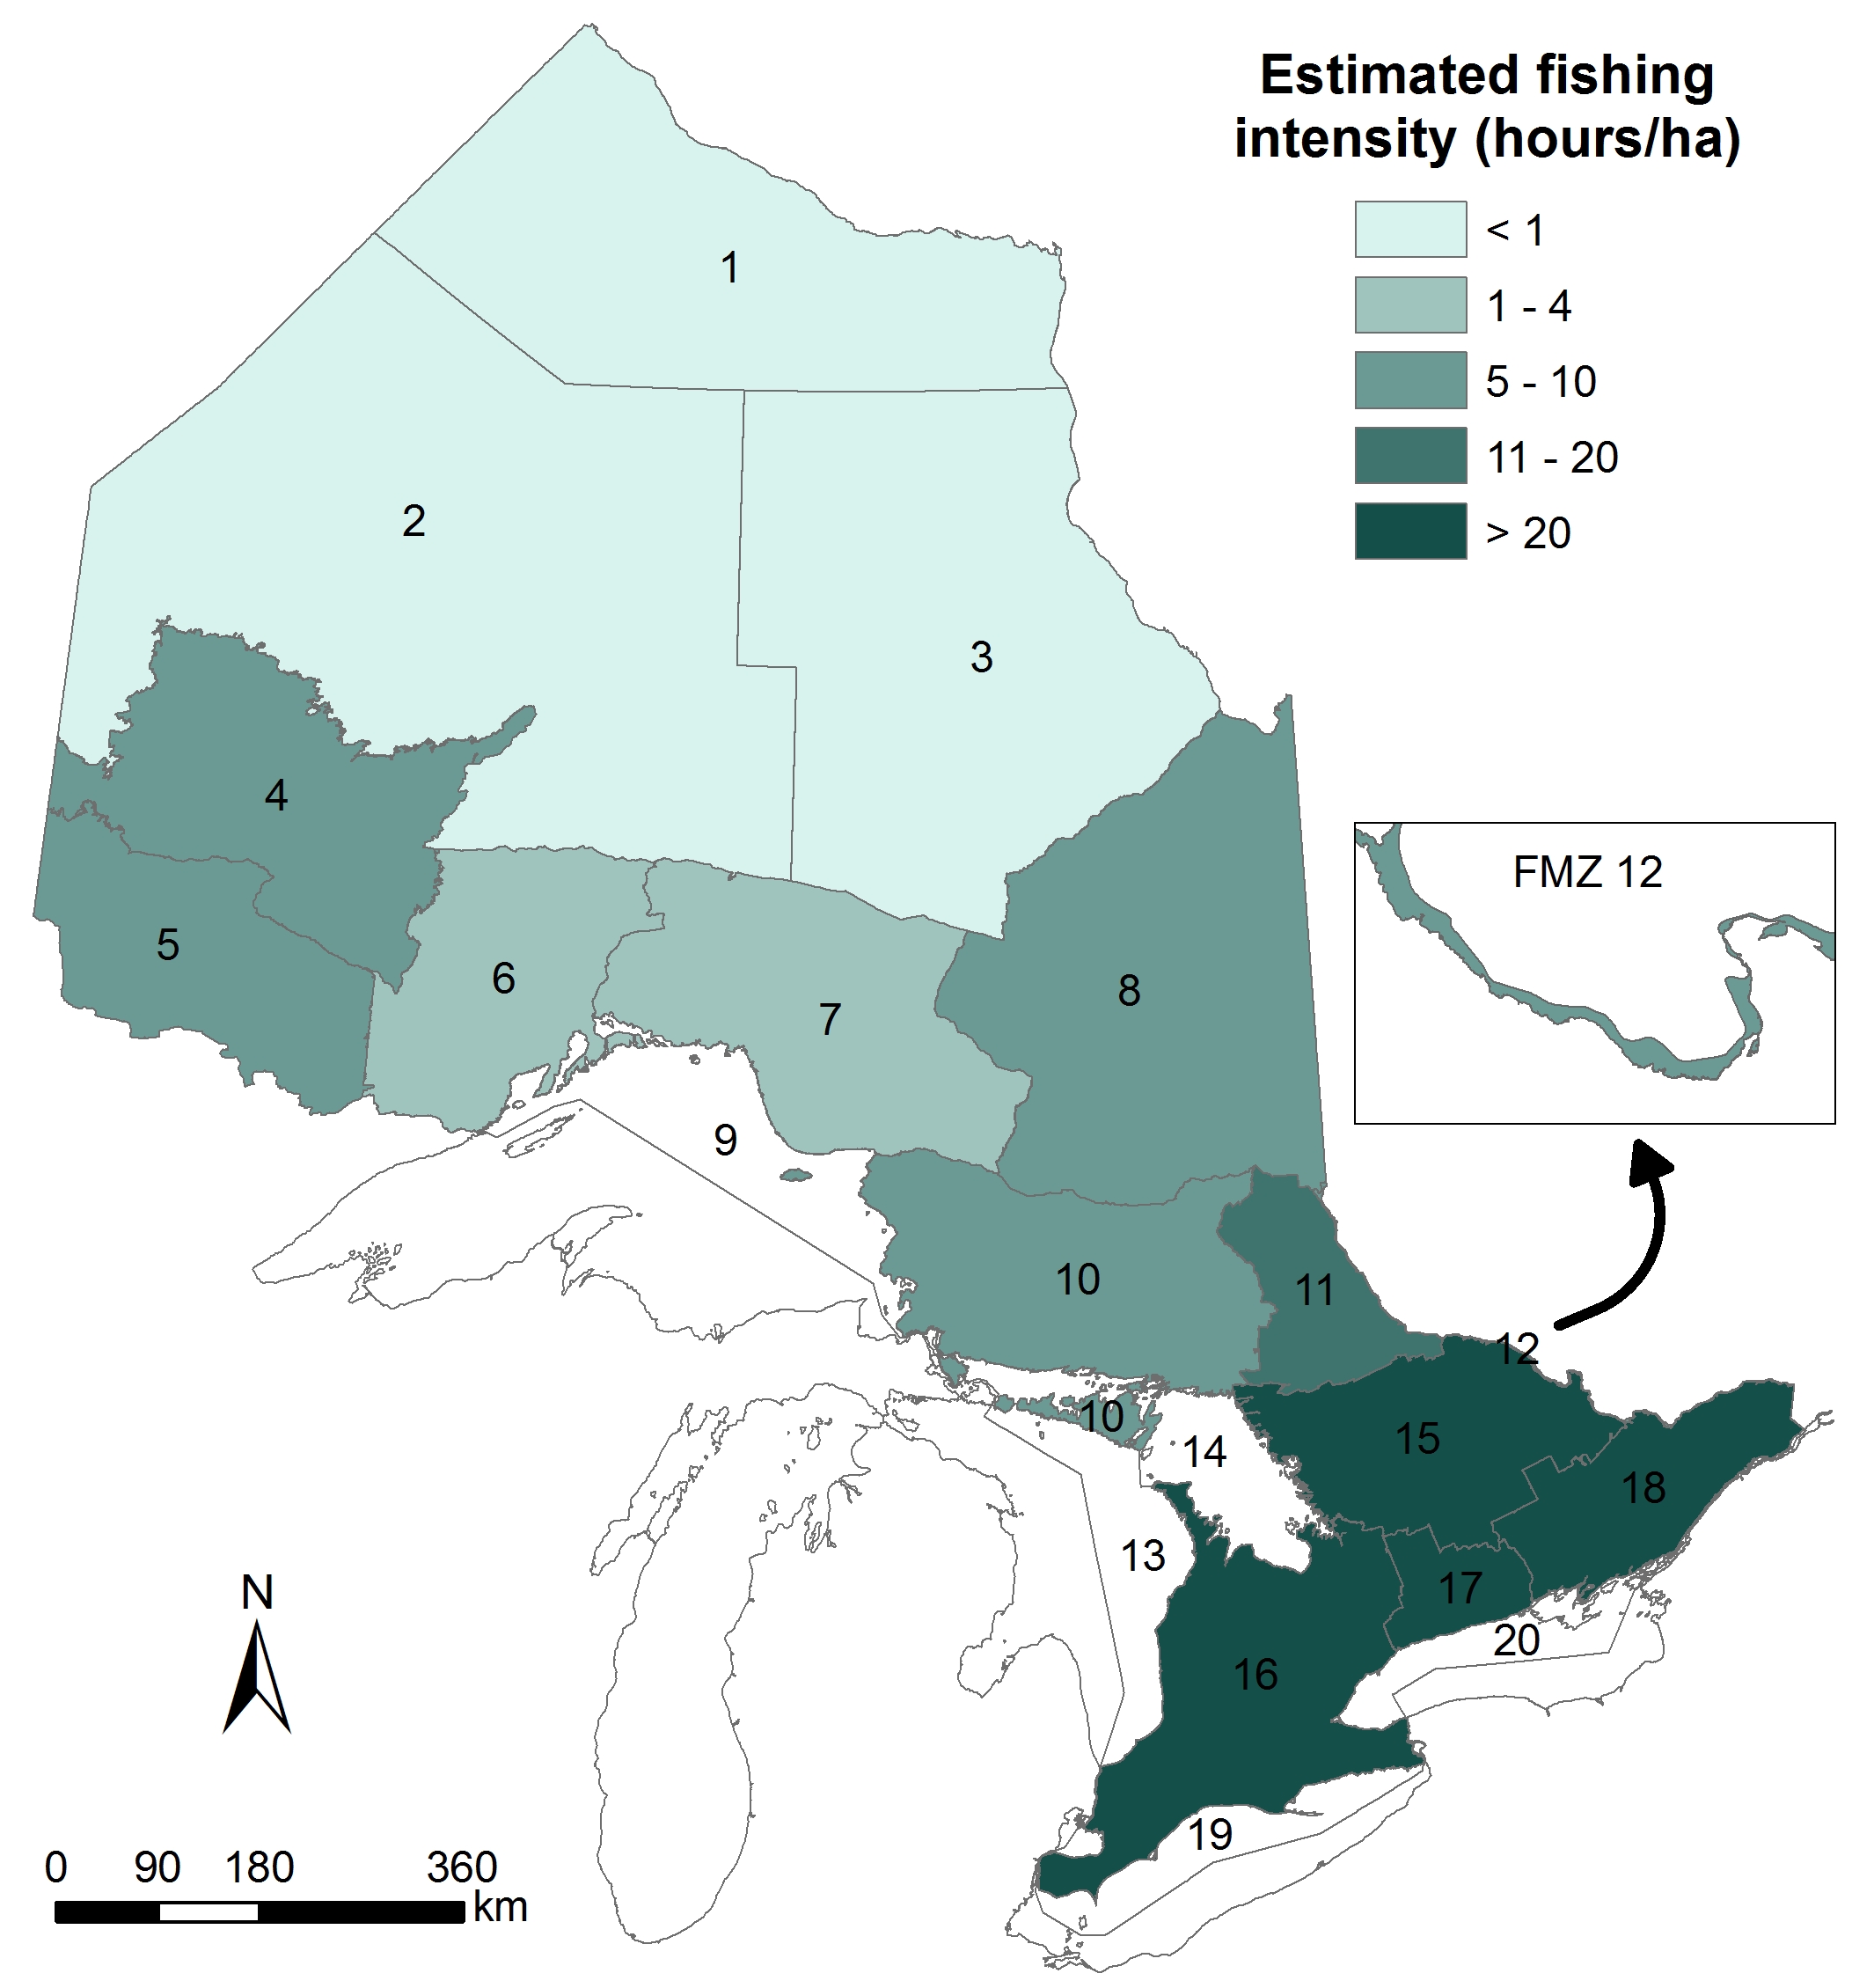
Figure 2. B) Estimated recreational lake fishing intensity (person-hours/ha) for lakes in Fisheries Management Zones in Ontario (Data for both panels are based on the 2010 Survey of Recreational Fishing in Canada [OMNRF 2014b]).
Figure 2. A) Estimated recreational fishing harvest of Walleye standardized by lake area (kg/ha) for lakes in inland Fisheries Management Zones in Ontario; B) Estimated recreational lake fishing intensity (person-hours/ha) for lakes in Fisheries Management Zones in Ontario (Data for both panels are based on the 2010 Survey of Recreational Fishing in Canada [OMNRF 2014b]).
Status:
- Estimated Walleye harvest by lake area is highest (> 2.0 kg/ha) in Fisheries Management Zone 11 in the Ontario Shield Ecozone. Estimated harvest in Zones 6, 8, 16 and 17 is also relatively high (1.57 – 1.80 kg/ha). Because of a warmer climate, lakes in southern Ontario can generally sustain higher harvest levels than lakes in the north (Lester et al. 2004).
- Recreational fishing intensity is high (> 20 hr/ha) in Fisheries Management Zones 16, 17, and 18 in the Mixedwood Plains Ecozone and in Zone 15 in the southern part of the Ontario Shield Ecozone. A greater proportion of fishing effort in these southern zones is directed at species other than Walleye.
- Fishing intensity decreases moving northward with very low levels of effort (< 1 hr/ha) in Fisheries Management Zones 1, 2 and 3 in the Far North.
Stress associated with fishing mortality – Estimates of Walleye fishing mortality were derived from the first cycle of BSM (2008-2012). Information to estimate mortality was available for 8% of Ontario’s 4,242 known inland Walleye lakes greater than 50 ha in size (Table 1). Total adult mortality rate per year for each population was estimated from the number of individuals in each age class (OMNRF 2014b). Estimates of natural mortality for each population were calculated using climate information (Growing Degree Days > 5 OC) and estimates of length at maturity (Lester et al. 2014). Fishing mortality for each Walleye population was calculated as the total adult mortality minus natural mortality. The level of fishing stress was then assessed by comparing estimated fishing and natural mortalities – Walleye populations with estimated fishing mortality equal to or greater than estimated natural mortality were assessed as having a high level of fishing stress (Kolding and van Zwieten 2014). Such levels of fishing mortality are likely to be higher than the value that maximizes sustainable yield (Lester et al. 2014). For each inland Fisheries Management Zone with sufficient data, the percentage of sampled Walleye lakes with high fishing stress was calculated and mapped (Figure 1). Fishing mortality estimates include all types of fishing – recreational, commercial and subsistence.
Table 1. Sample size of Walleye lakes from Broad-Scale Monitoring used to estimate mortality in each Fisheries Management Zone (FMZ) compared with number of known Walleye populations in lakes > 50 ha.
| FMZ |
Sample size |
Known Walleye populations |
% of known lakes sampled |
| 1 |
3 |
5 |
60 |
| 2 |
12 |
570 |
2 |
| 3 |
0 |
26 |
0 |
| 4 |
82 |
829 |
10 |
| 5 |
79 |
674 |
12 |
| 6 |
55 |
325 |
17 |
| 7 |
31 |
472 |
7 |
| 8 |
32 |
496 |
6 |
| 10 |
19 |
282 |
7 |
| 11 |
22 |
151 |
15 |
| 12 |
3 |
6 |
50 |
| 15 |
12 |
222 |
5 |
| 16 |
7 |
31 |
23 |
| 17 |
8 |
37 |
22 |
| 18 |
9 |
116 |
8 |
| Total |
374 |
4242 |
8 |
Harvest and fishing intensity – Estimates of recreational Walleye harvest and fishing intensity were based on Ontario respondents to the 2010 Survey of Recreational Fishing in Canada. Responses were received from 39.6% of 29,892 licenced anglers who received the mail-based survey (OMNRF 2014c). A follow-up phone survey of 10% of non-respondents was conducted to account for non-response bias. Estimates of the number of Walleye harvested in lakes in each of Ontario’s inland Fisheries Management Zones were developed by applying appropriate weighting to geographically referenced responses (OMNRF 2014c). A standard measure of Walleye harvest for lakes in each Fisheries Management Zone (kg/hectare) was derived by multiplying the estimated number of harvested fish by 0.748 kg (mean weight of Walleye from historical creel survey data in Ontario) and dividing by the area of known Walleye lakes (Figure 2). Fishing intensity (person-hours of effort/hectare) for lakes in each inland Fisheries Management Zone was measured in a similar fashion based on survey responses (Figure 2). Fishing intensity is reported for all species combined as several respondents targeted multiple species or did not specify target species (OMNRF 2014c). In the north (i.e., FMZ’s 2-12), Walleye is the most sought after and frequently captured fish species and therefore total fishing effort is a reliable index of Walleye fishing intensity. In the more southern Fisheries Management Zones (FMZ’s 15-18), a greater proportion of the total fishing effort is directed at other species such as Smallmouth Bass and Largemouth Bass.
Related Target(s)
Web Links:
OMNRF – Management of Fish in Ontario https://www.ontario.ca/document/provincial-fish-strategy-background
Fish Ontario – Broad-scale Monitoring of lakes program https://www.ontario.ca/environment-and-energy/methods-monitoring-fish-populations
Fisheries and Oceans Canada – Survey of Recreational Fishing in Canada http://www.dfo-mpo.gc.ca/stats/rec/canada-rec-eng.htm
References:
Dextrase, A.J., N.P. Lester, H.E. Ball, and K.B. Armstrong. 2016. An assessment of fishing stress on Walleye in Ontario’s inland lakes based on mortality estimates from the Broad-scale Monitoring Program, 2008 – 2012. State of Ontario’s Biodiversity Technical Report Series, Report #SOBTR-06. Ontario Biodiversity Council, Peterborough, ON.
Kolding, J., and P.A.M. van Zwieten. 2014. Sustainable fishing of inland waters. Journal of Limnology 73(Supplement 1):132-148
Lester, N.P., A.J. Dextrase, R.S. Kushneriuk, M.R. Rawson, and P.A. Ryan. 2004. Light and temperature: key factors affecting walleye abundance and production. Transactions of the American Fisheries Society 133:588–605.
Lester, N.P., B.J. Shuter, P. Venturelli, and D. Nadeau. 2014. Life-history plasticity and sustainable exploitation: a theory of growth compensation applied to walleye management. Ecological Applications 24:38-54.
Ontario Ministry of Natural Resources and Forestry (OMNRF). 2014a. 2010 Survey of recreational fishing in Canada: selected results for Ontario fisheries – Draft. Biodiversity Branch. Ontario Ministry of Natural Resources and Forestry, Peterborough, ON.
Ontario Ministry of Natural Resources and Forestry (OMNRF). 2014b. Guide to lake synopsis: broad-scale monitoring. Science and Research Branch, Ontario Ministry of Natural Resources and Forestry, Peterborough, ON.
Ontario Ministry of Natural Resources and Forestry (OMNRF). 2014c. 2010 Survey of recreational fishing in Canada: results for fisheries management zones of Ontario – Draft. Biodiversity Branch. Ontario Ministry of Natural Resources and Forestry, Peterborough, ON.


