
Measuring the Benefits of Best Management Practices in Gully Creek
Intermittent channels across the land contribute to poor water quality during storms. Runoff and erosion can add sediment to surface water such as creeks, rivers, and lakes. High levels of suspended sediment can negatively affect aquatic species by clogging gills, impairing the quality of fish habitat, limiting the ability of ‘sight feeders’ to feed, reducing growth, and limiting disease tolerance. The negative effects of this sediment and nutrient enrichment could affect the habitat of species at risk such as Redside dace (Clinostomus elongatus).
The reduction of suspended sediment and associated nutrients from structural best management practices such as a grassy ditch or Water and Sediment Control Basin (WASCoB) can be monitored at a site scale. It is harder to monitor the site-scale benefits to water quality and aquatic habitat of land management best management practices (BMPs) such as cover crops, nutrient management, and conservation tillage. This is why The Crops and Creeks Huron Watershed-Based Best Management Practices Evaluation (WBBE) project evaluated BMPs using the Soil and Water Assessment Tool (SWAT) model.
SWAT determined that the studied BMPs typically reduced nutrient and sediment loading to Gully Creek in Huron County. Monitoring suggests that some best management practices have immediate and measurable benefits for downstream biota. At the same time, implementing more BMPs that improve soil health will also help to reduce field-scale erosion and improve downstream habitat for aquatic species. The study found that combining different types of BMPs in a field is better than just using one BMP by itself.
Landowners can reduce their impacts on downstream water quality and aquatic habitat within a field by installing a berm or Water and Sediment Control Basin (WASCoB). They can also use an edge-of-field practice such as a grassy ditch. However, land management practices that improve soil health and reduce erosion and keep sediment out of intermittent watercourses have a predominant role. Agricultural producers can achieve environmental benefits through management of nutrients (such as fertilizer and manure), planting of cover crops (such as rye, red clover, or oilseed radish), and conservation tillage (leaving crop residue such as wheat stubble or corn stalks on the land to limit runoff and soil erosion).
The Crops and Creeks Huron Watershed-Based Best Management Practices Evaluation (WBBE) project was completed with the support of landowners in Gully Creek, Spring Creek, Zurich Drain and Ridgeway Drain, Ausable Bayfield Conservation Authority (ABCA), Huron County Federation of Agriculture (HCFA), and Ontario Ministry of Agriculture, Food and Rural Affairs (OMAFRA), with funding from the Canada-Ontario Agreement Respecting the Great Lakes Ecosystem.
Restoring Habitat for Redside Dace on the Bettles Family Farm
The Bettles family farm is located north of Bayfield, Ontario in the Gully Creek area, part of the Ausable Bayfield Conservation Authority (ABCA). Gully Creek has a 15-square-kilometre watershed in Huron County that flows directly into Lake Huron. The endangered Redside Dace is an aquatic species at risk in the watershed. Soil erosion has caused sediment to accumulate downstream, covering the gravel bottom, a key aspect of habitat for the Redside Dace.
A grassed ditch on the Bettles’ property was monitored to evaluate its effectiveness in improving water quality and habitat for the Redside Dace. It was found that the ditch acted as a filter to reduce total suspended solids (TSS), total phosphorus (TP), and soluble reactive phosphorus (SRP) concentrations in surface runoff, but did not improve nitrate (N) concentrations. On average, TP declined by 47%, SRP by 63%, and TSS by 48% during runoff events between June 2011 and March 2012 (Figure 1).
When ABCA staff showed these results to the landowner, he saw the opportunity to expand his hayfield and increase environmental improvements. After he established the expanded hayfield, there was no evidence of continued overland water flow from the field to the creek. Because there was no more runoff it was no longer possible, nor even necessary, to collect water samples to assess water quality. The observed reduction in runoff is expected to reduce sediment concentrations downstream and improve habitat for Redside Dace.
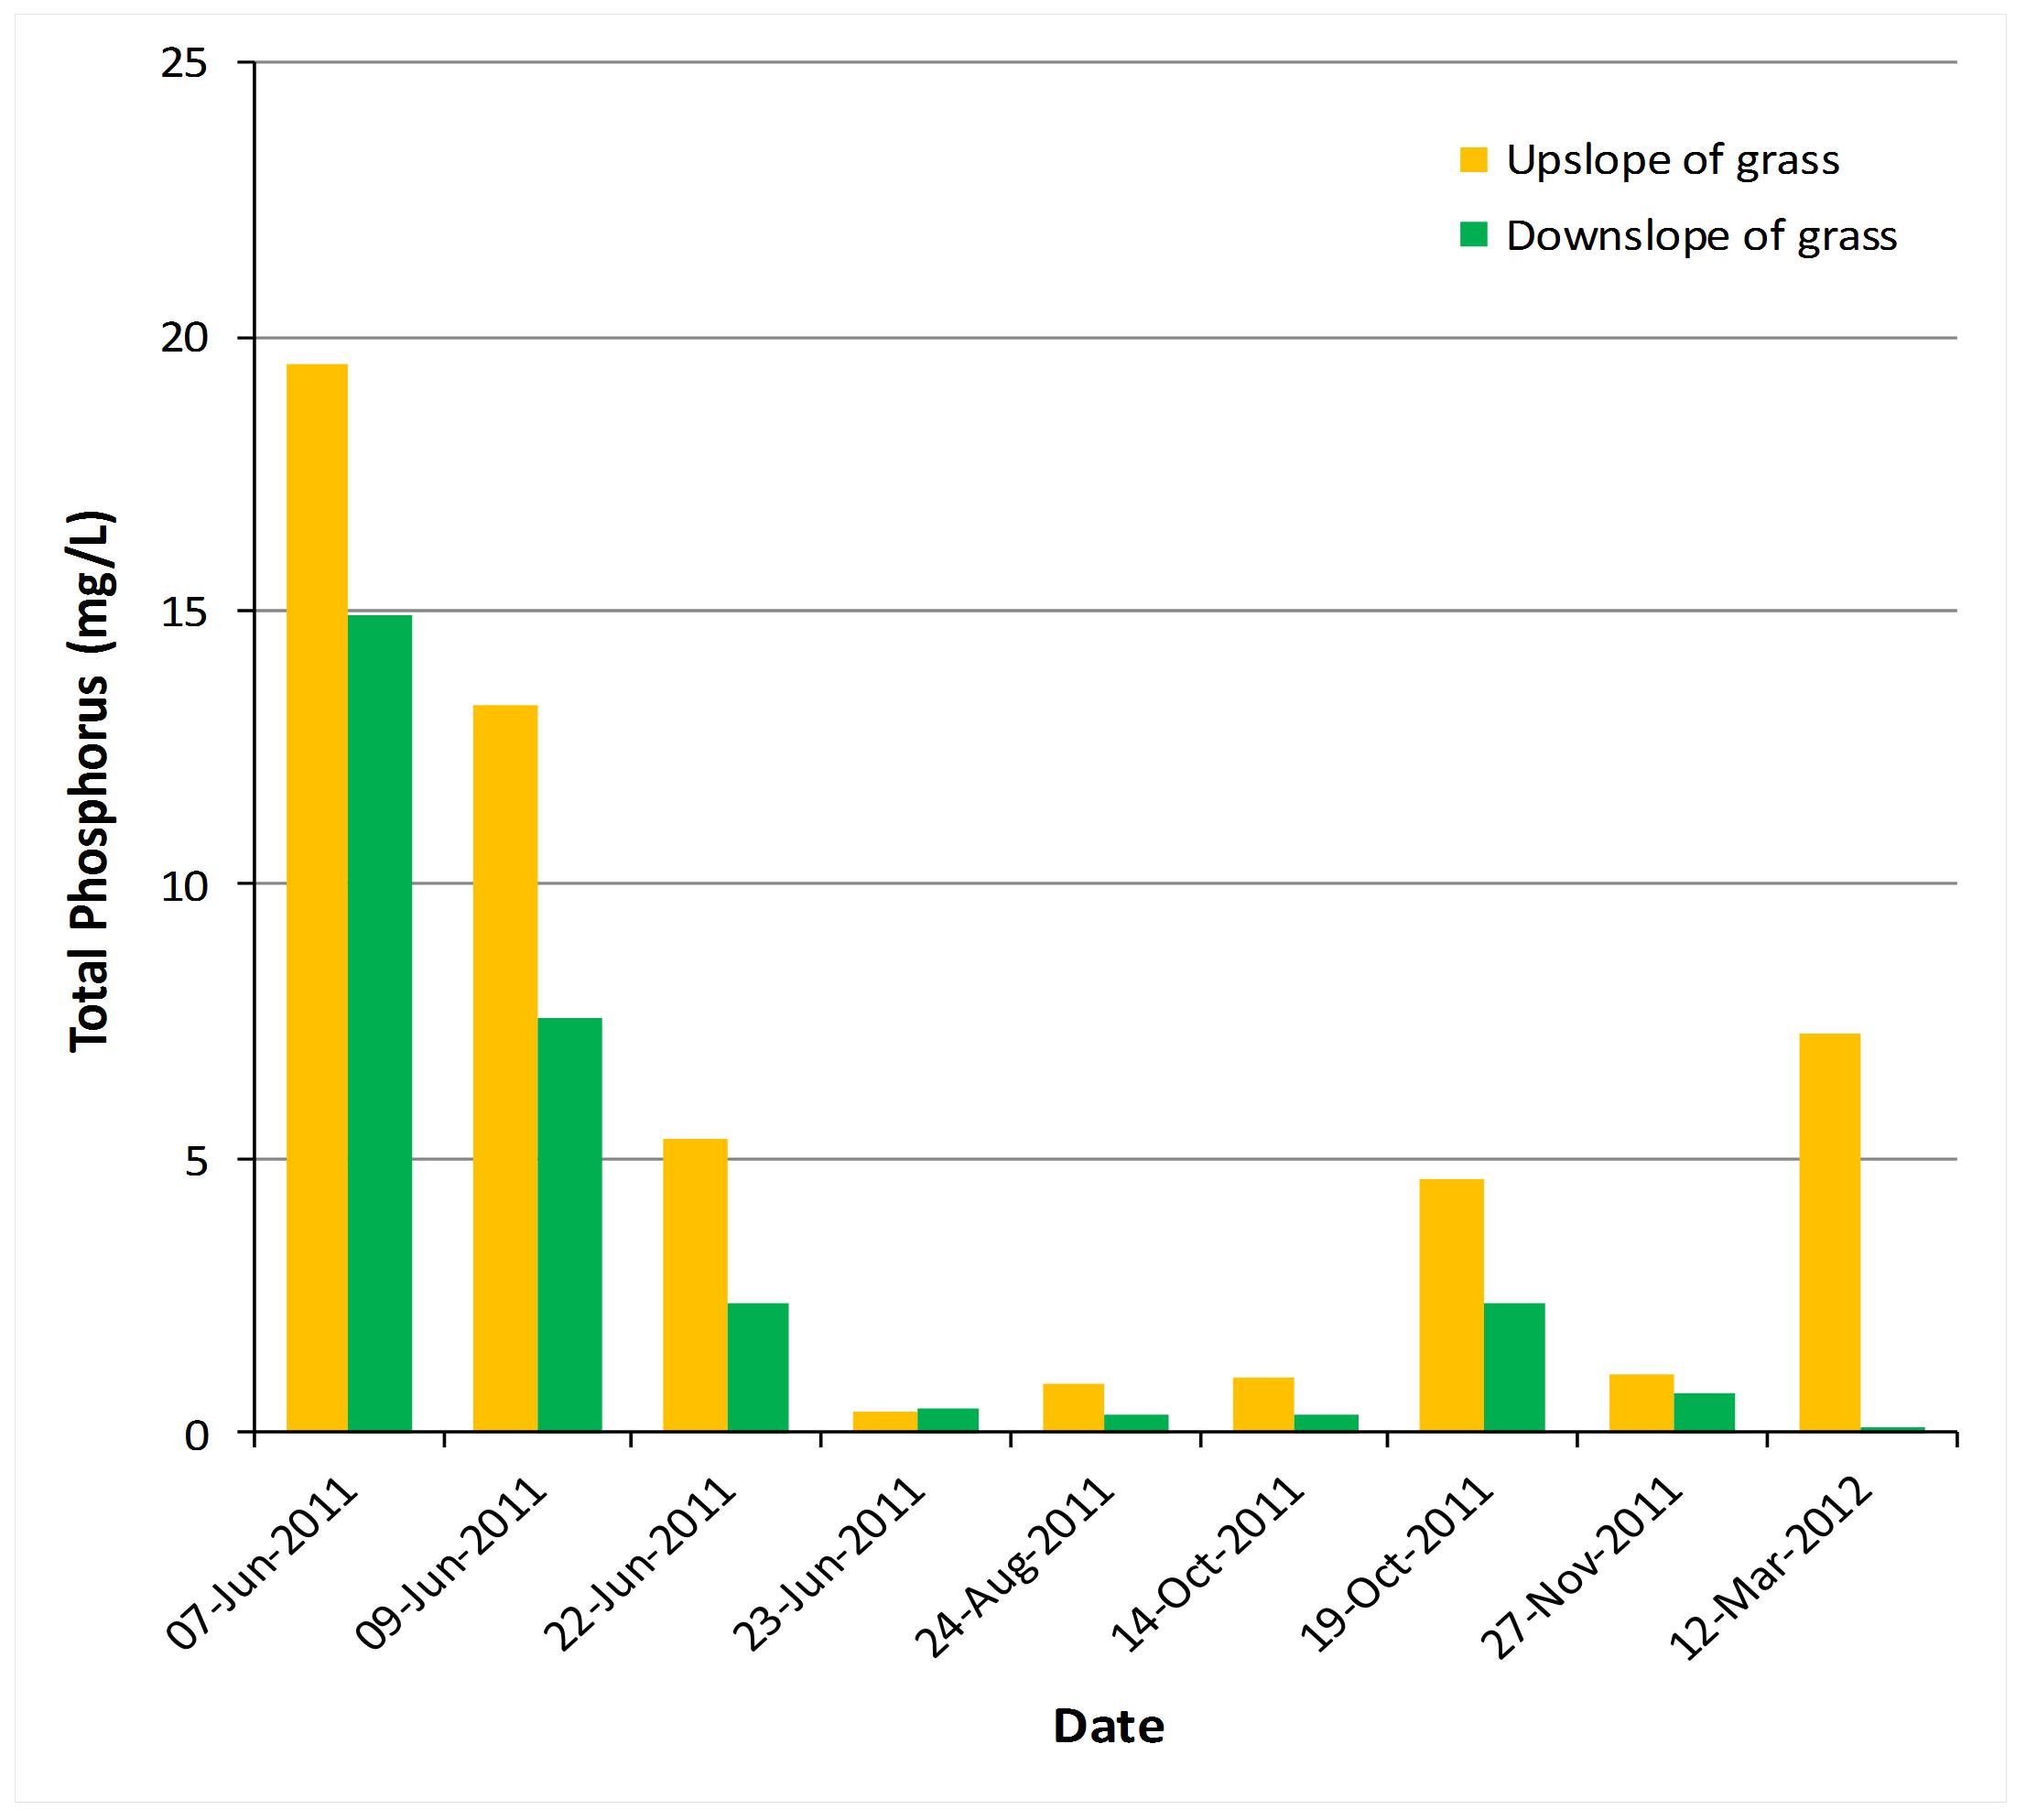
Figure 1. Edge-of-field monitoring showing Total Phosphorus concentrations upstream and downstream of the grassed ditch (filter strip).
Figure 1. Edge-of-field monitoring showing Total Phosphorus concentrations upstream and downstream of the grassed ditch (filter strip).
Stream Restoration and Wetland Creation
Ann and Bill Phelan have a wooded property mid-watershed and Gully Creek runs directly through their land. This means that not only do they have erosion problems caused by runoff from properties upstream, but also the water running off their property can cause erosion further downstream.
The Phelans worked with Ausable Bayfield Conservation Authority (ABCA), Bayfield Angler’s Association, Scouts Canada, and the Friends of Hullett Marsh to reduce downstream effects by undertaking riparian restoration in 2009 and creating a wetland in 2011. Since its creation, the wetland has controlled water flow and prevented downstream erosion of adjacent farmland.
The work the Phelans have done is a model of how existing natural areas can be enhanced to further protect our landscape and improve water quality, according to Mari Veliz, Healthy Watersheds Supervisor at Ausable Bayfield Conservation.
Practices that reduce sediment movement in the uplands benefit the habitat of aquatic species at risk because they prevent inputs of sediment which would otherwise cover up the downstream habitat.
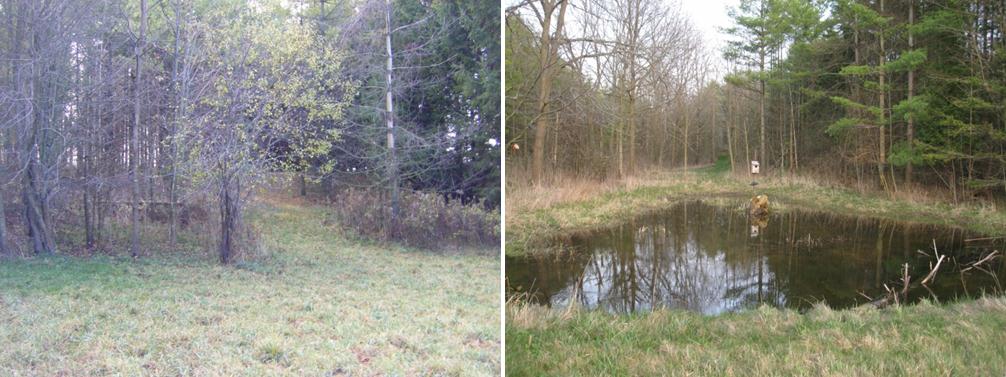
Figure 2: Wetland area prior to construction in November 2009 (left) and after construction in March 2012.
Figure 2. Wetland area prior to construction in November 2009 (left) and after construction in March 2012.
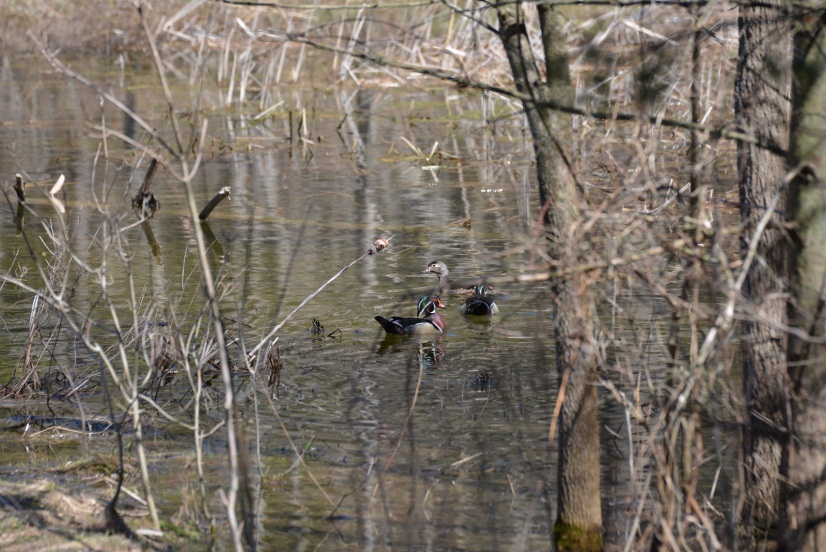
Figure 3. Wetland area with Wood Ducks in April of 2014.
Figure 3. Wetland area with Wood Ducks in April of 2014.