
Indicator
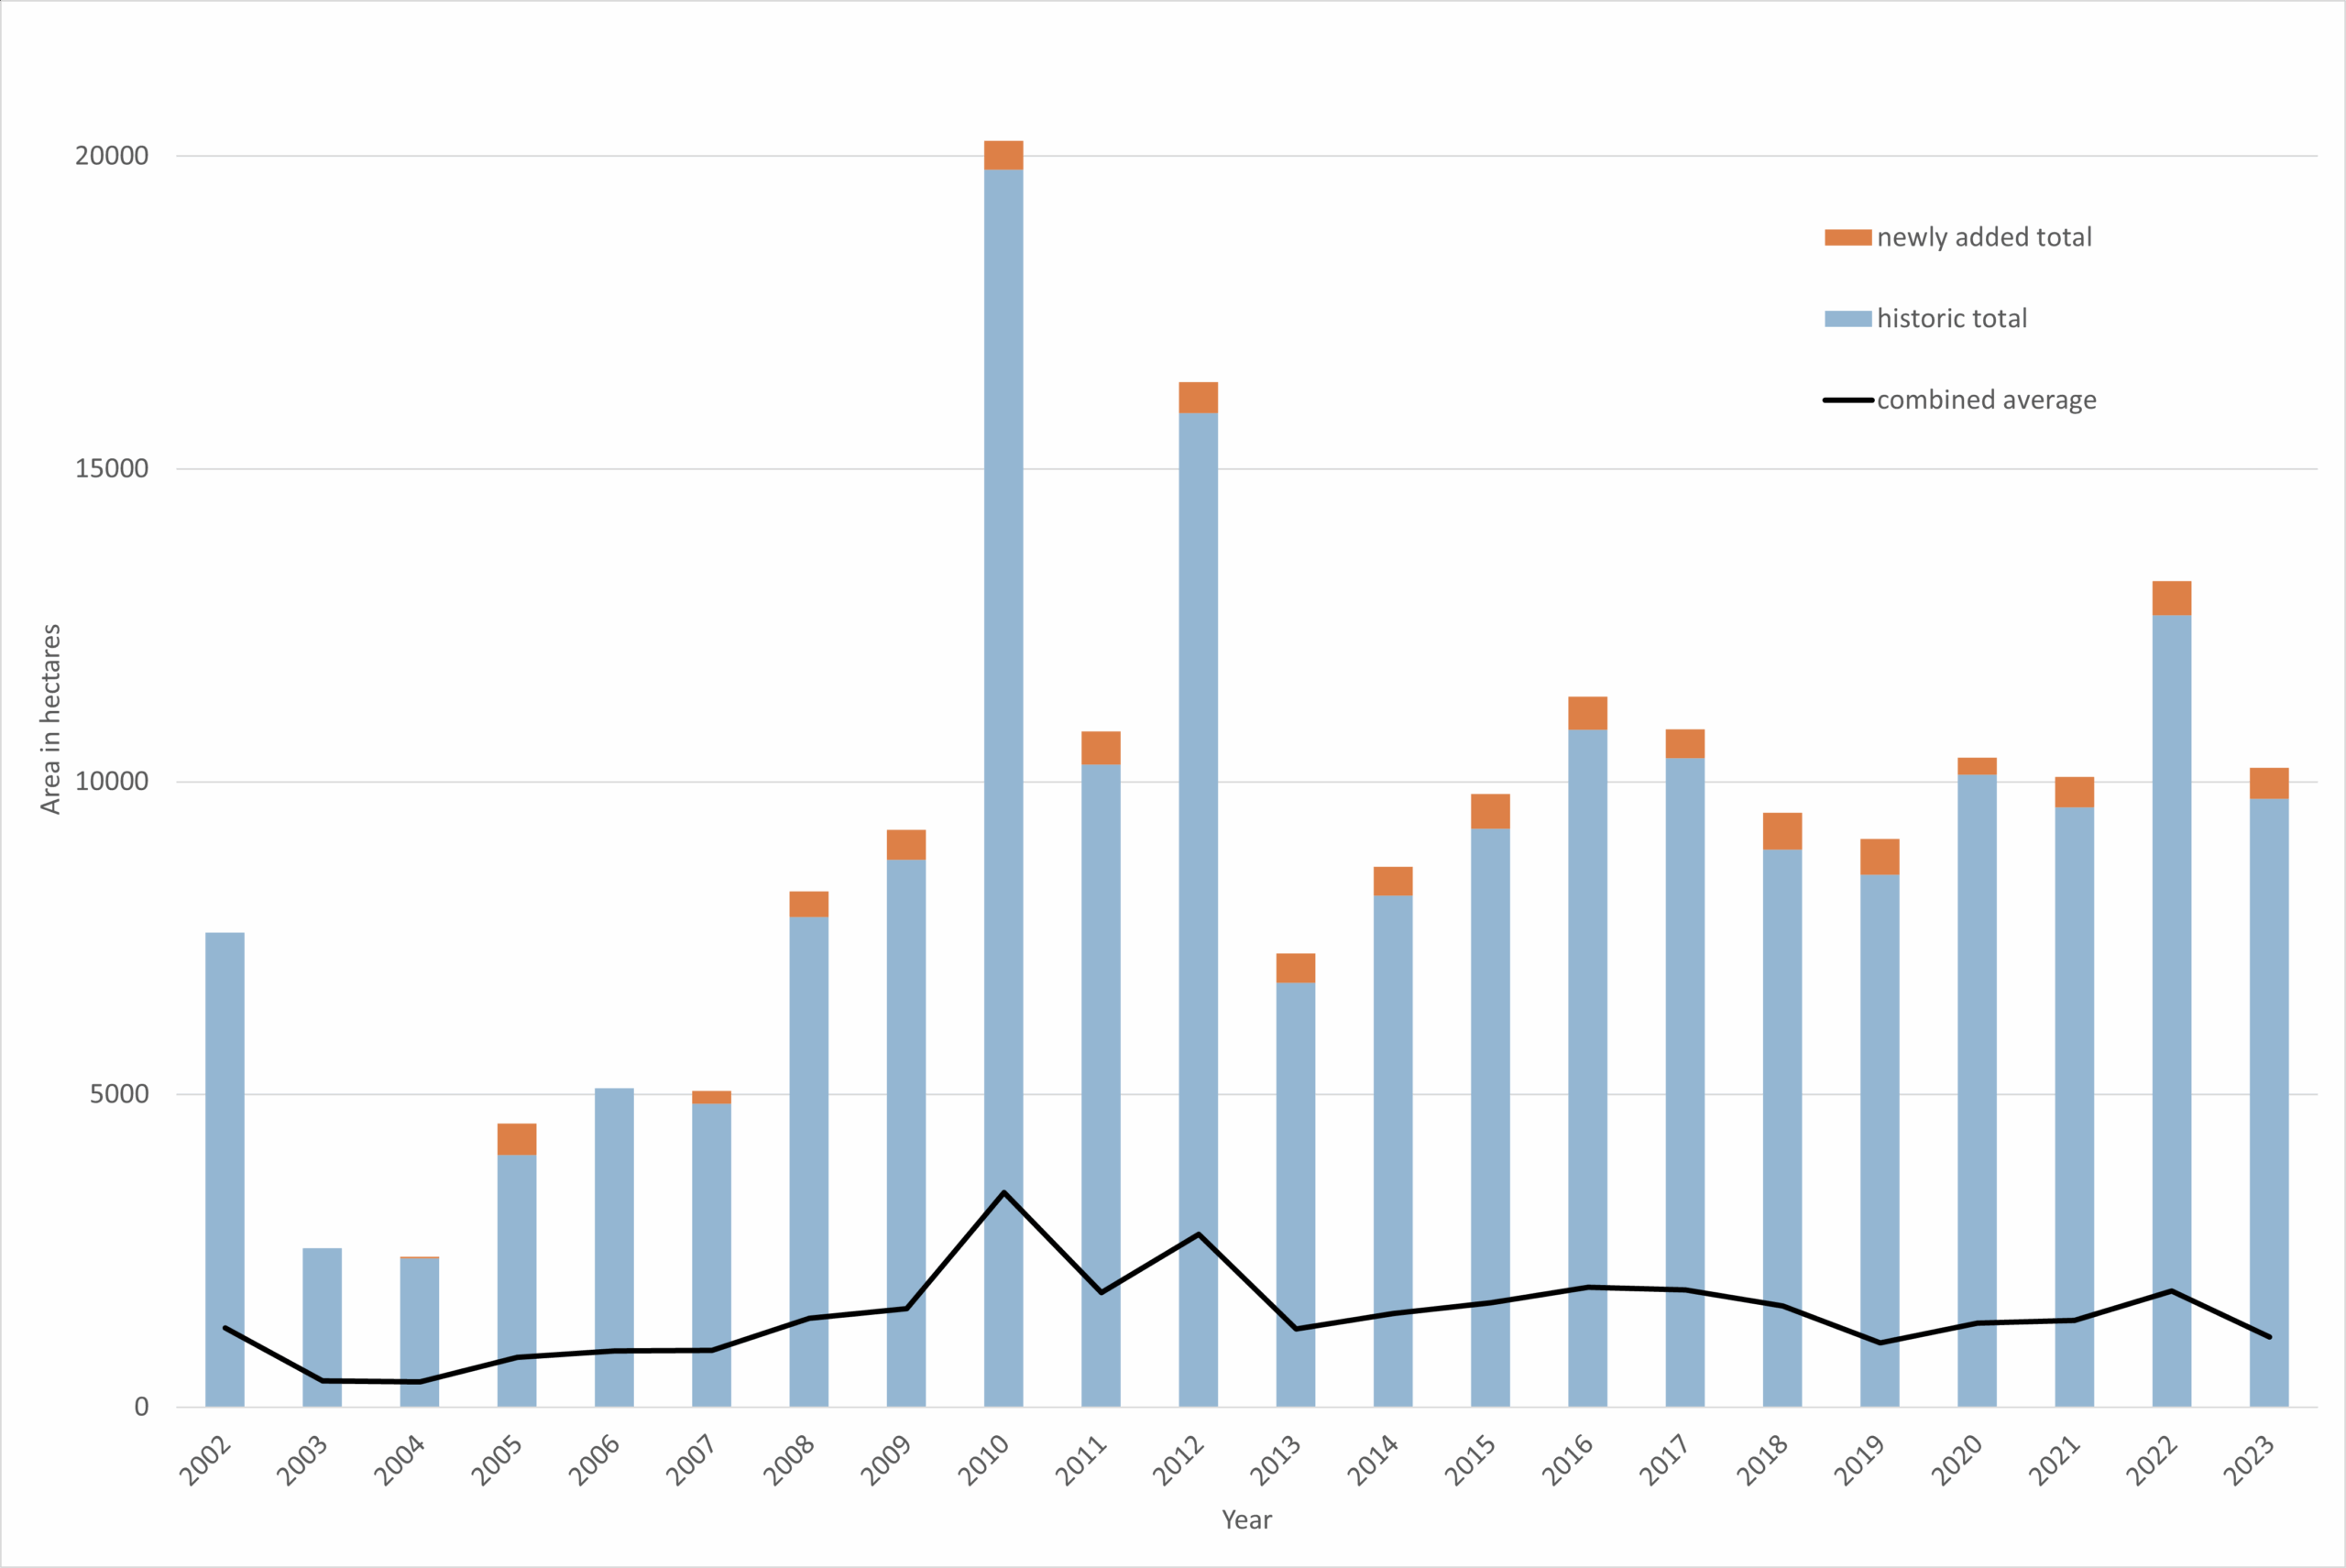
Figure 1. Annual total and average area (in hectares) being restored by all organizations each year under restoration and stewardship in Ontario between 2002–2023 (Source: Ducks Unlimited Canada, Nature Conservancy of Canada, Ontario Federation of Anglers and Hunters, Conservation Ontario, Ontario Power Generation and Ontario Ministry of Natural Resources’ Stewardship Program, Ontario Nature, Carolinian Canada, Watersheds Canada, Forests Canada).
Notes: Data for the Ontario Ministry of Natural Resources Stewardship Program was only available for the years 2004–2012. Data for the Ontario Federation of Anglers and Hunters was only available for the years 2010–2023.
Trend analysis
There is high variability in the number of hectares under restoration and stewardship between years. In part, this is likely due to the inconsistent availability of data since tracking began in 2002. This means that assessing trends should be done with caution.
A simple linear regression of the annual average number of hectares under restoration and stewardship revealed a positive slope which suggests an increasing trend over time. The analysis produced a statistically significant r2 value of 0.2366 which suggests a low to moderate relationship between the area under restoration and stewardship (in hectares) and time (2002 to 2023) (see Figure 2). In other words, there has been an increase in the annual total number of hectares under restoration and stewardship in Ontario since 2002, based on the information provided by the tracked organizations. When years 2010 and 2012 are removed from the analysis, the r2 value is 0.71. During each of these years, there was a significant increase in funding provided through the Ontario Ministry of Natural Resources Stewardship Program.
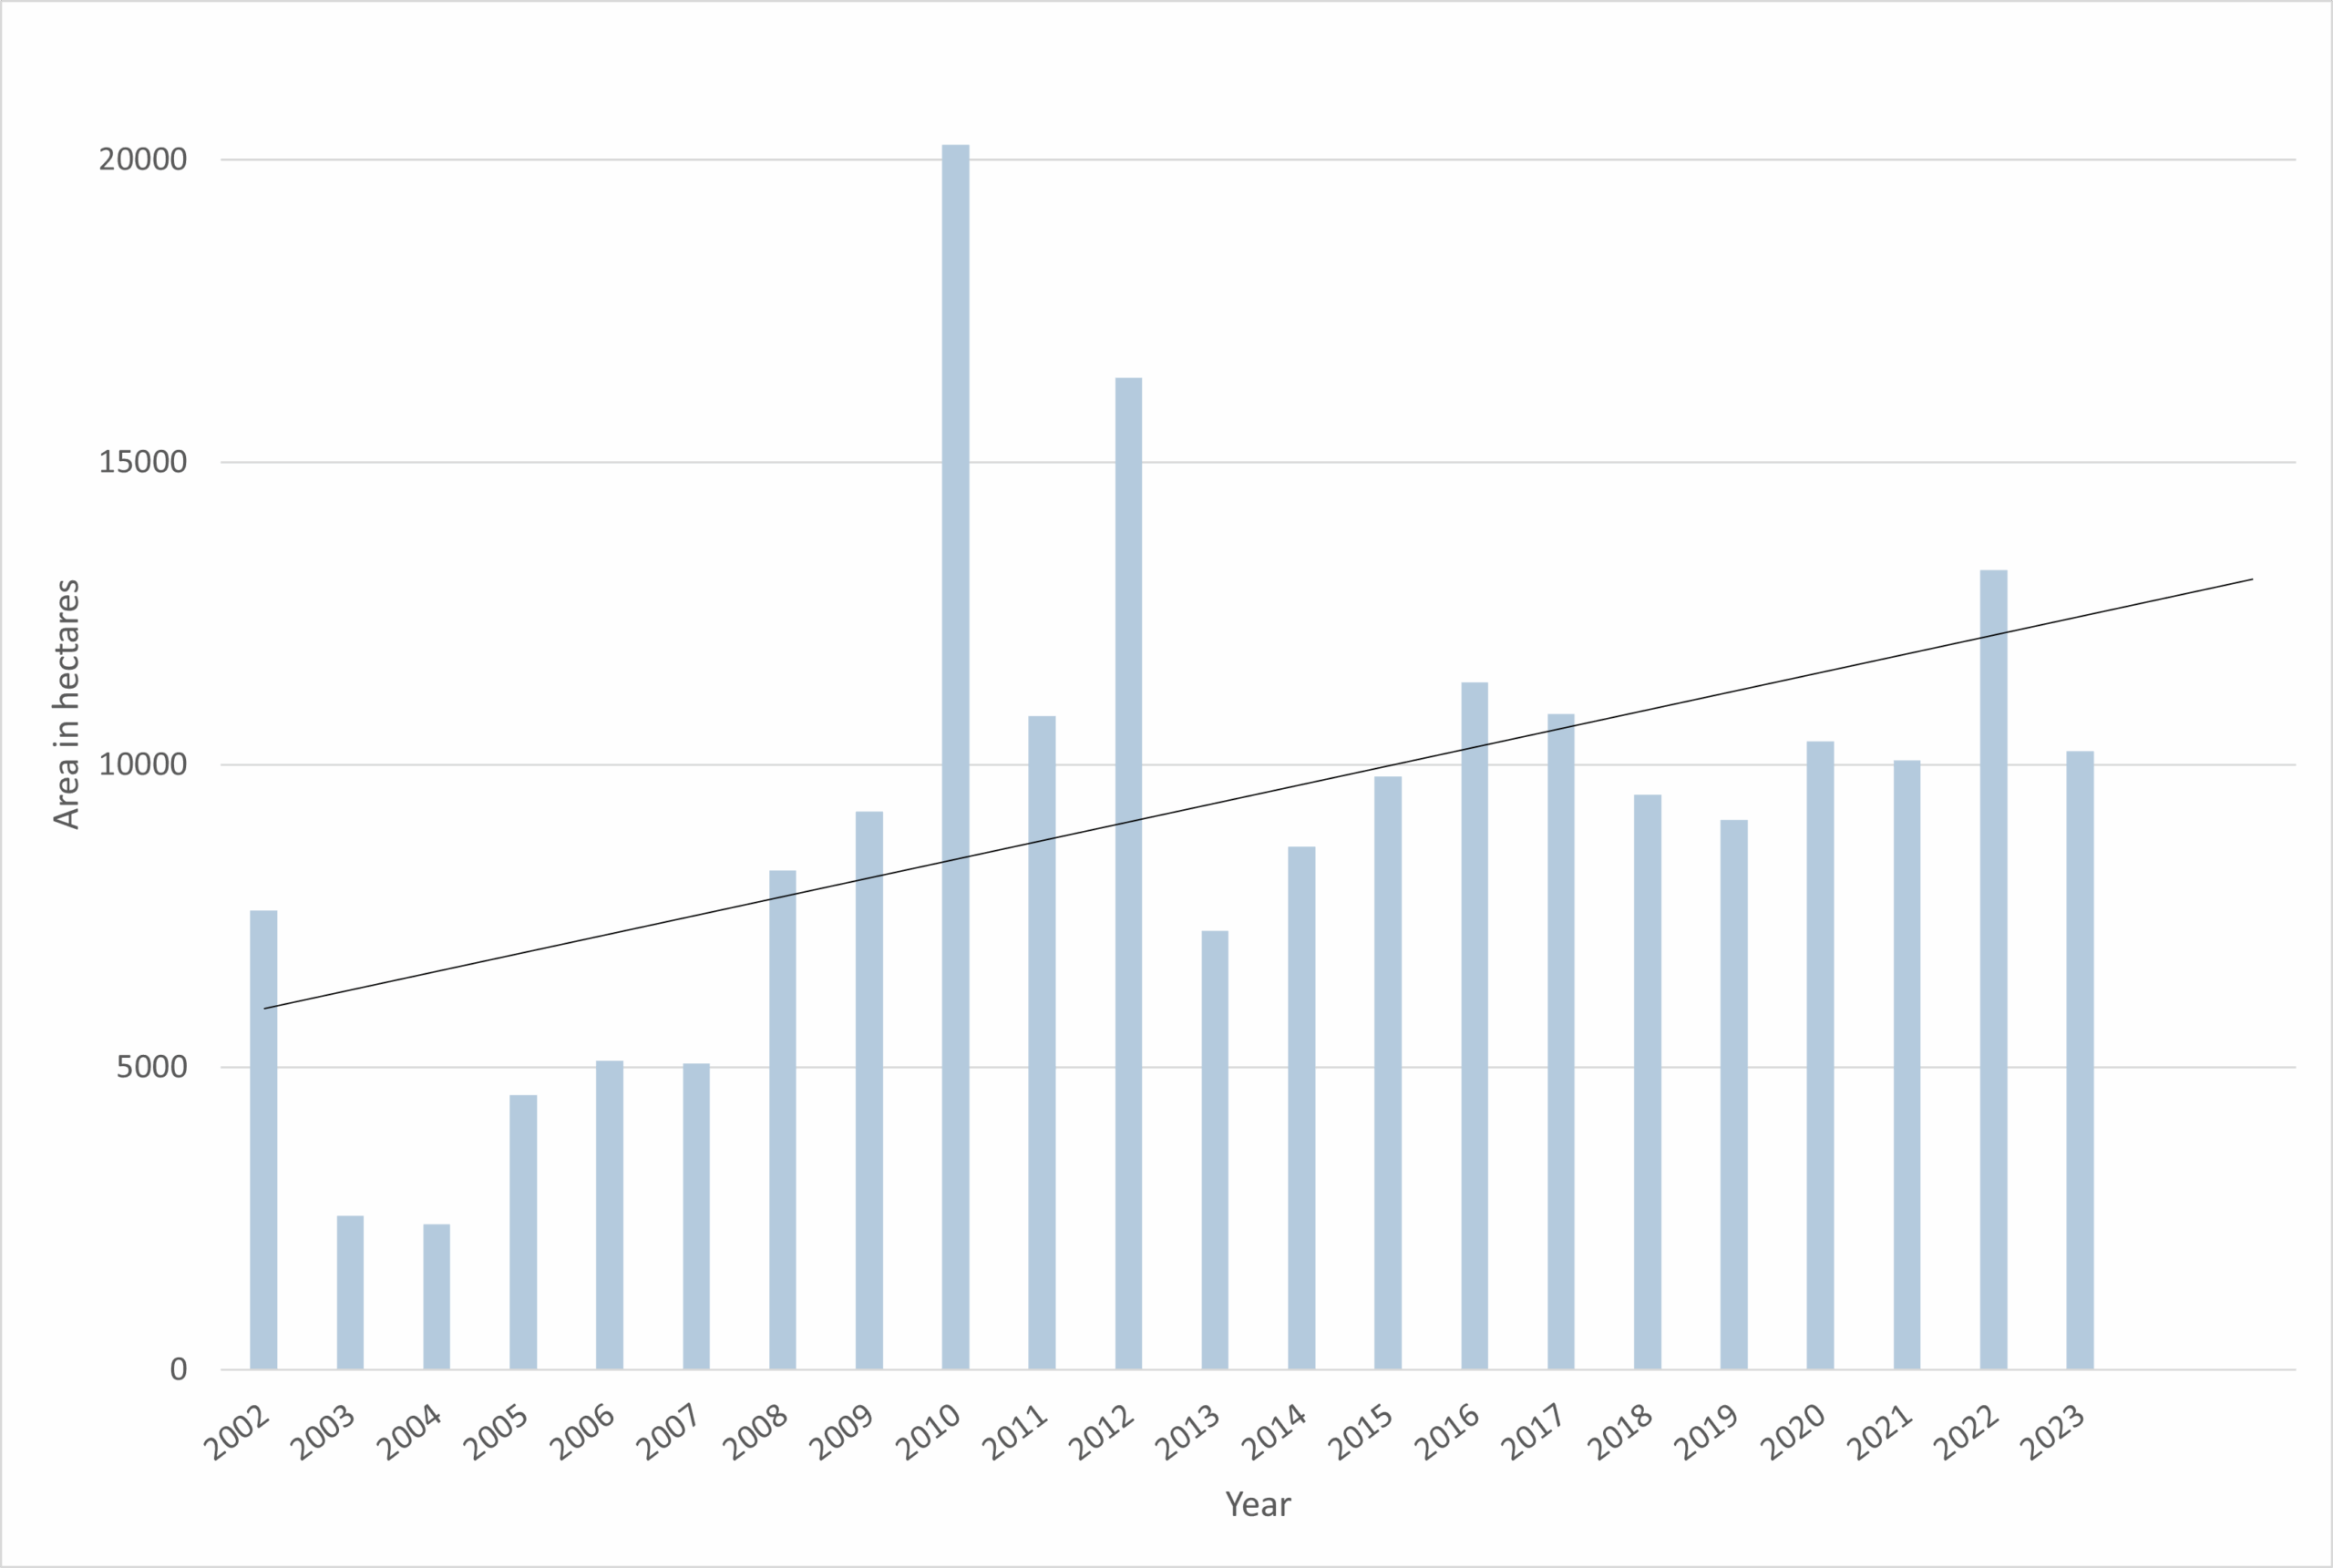
Figure 2. Total annual average area under restoration and stewardship in hectares over years with trend line.
The degree of change in annual average hectares over time is shown in Figure 3 as the average number of hectares in 5-year intervals. The average hectares for the 5-year time period of 2002 to 2006 is 758.36 while the average annual hectares in the most recent period of 2022 to 2023 is 1490.30. This is an increase of 732.24 hectares (equivalent to approximately 684 Canadian football fields), which is an increase of nearly double.
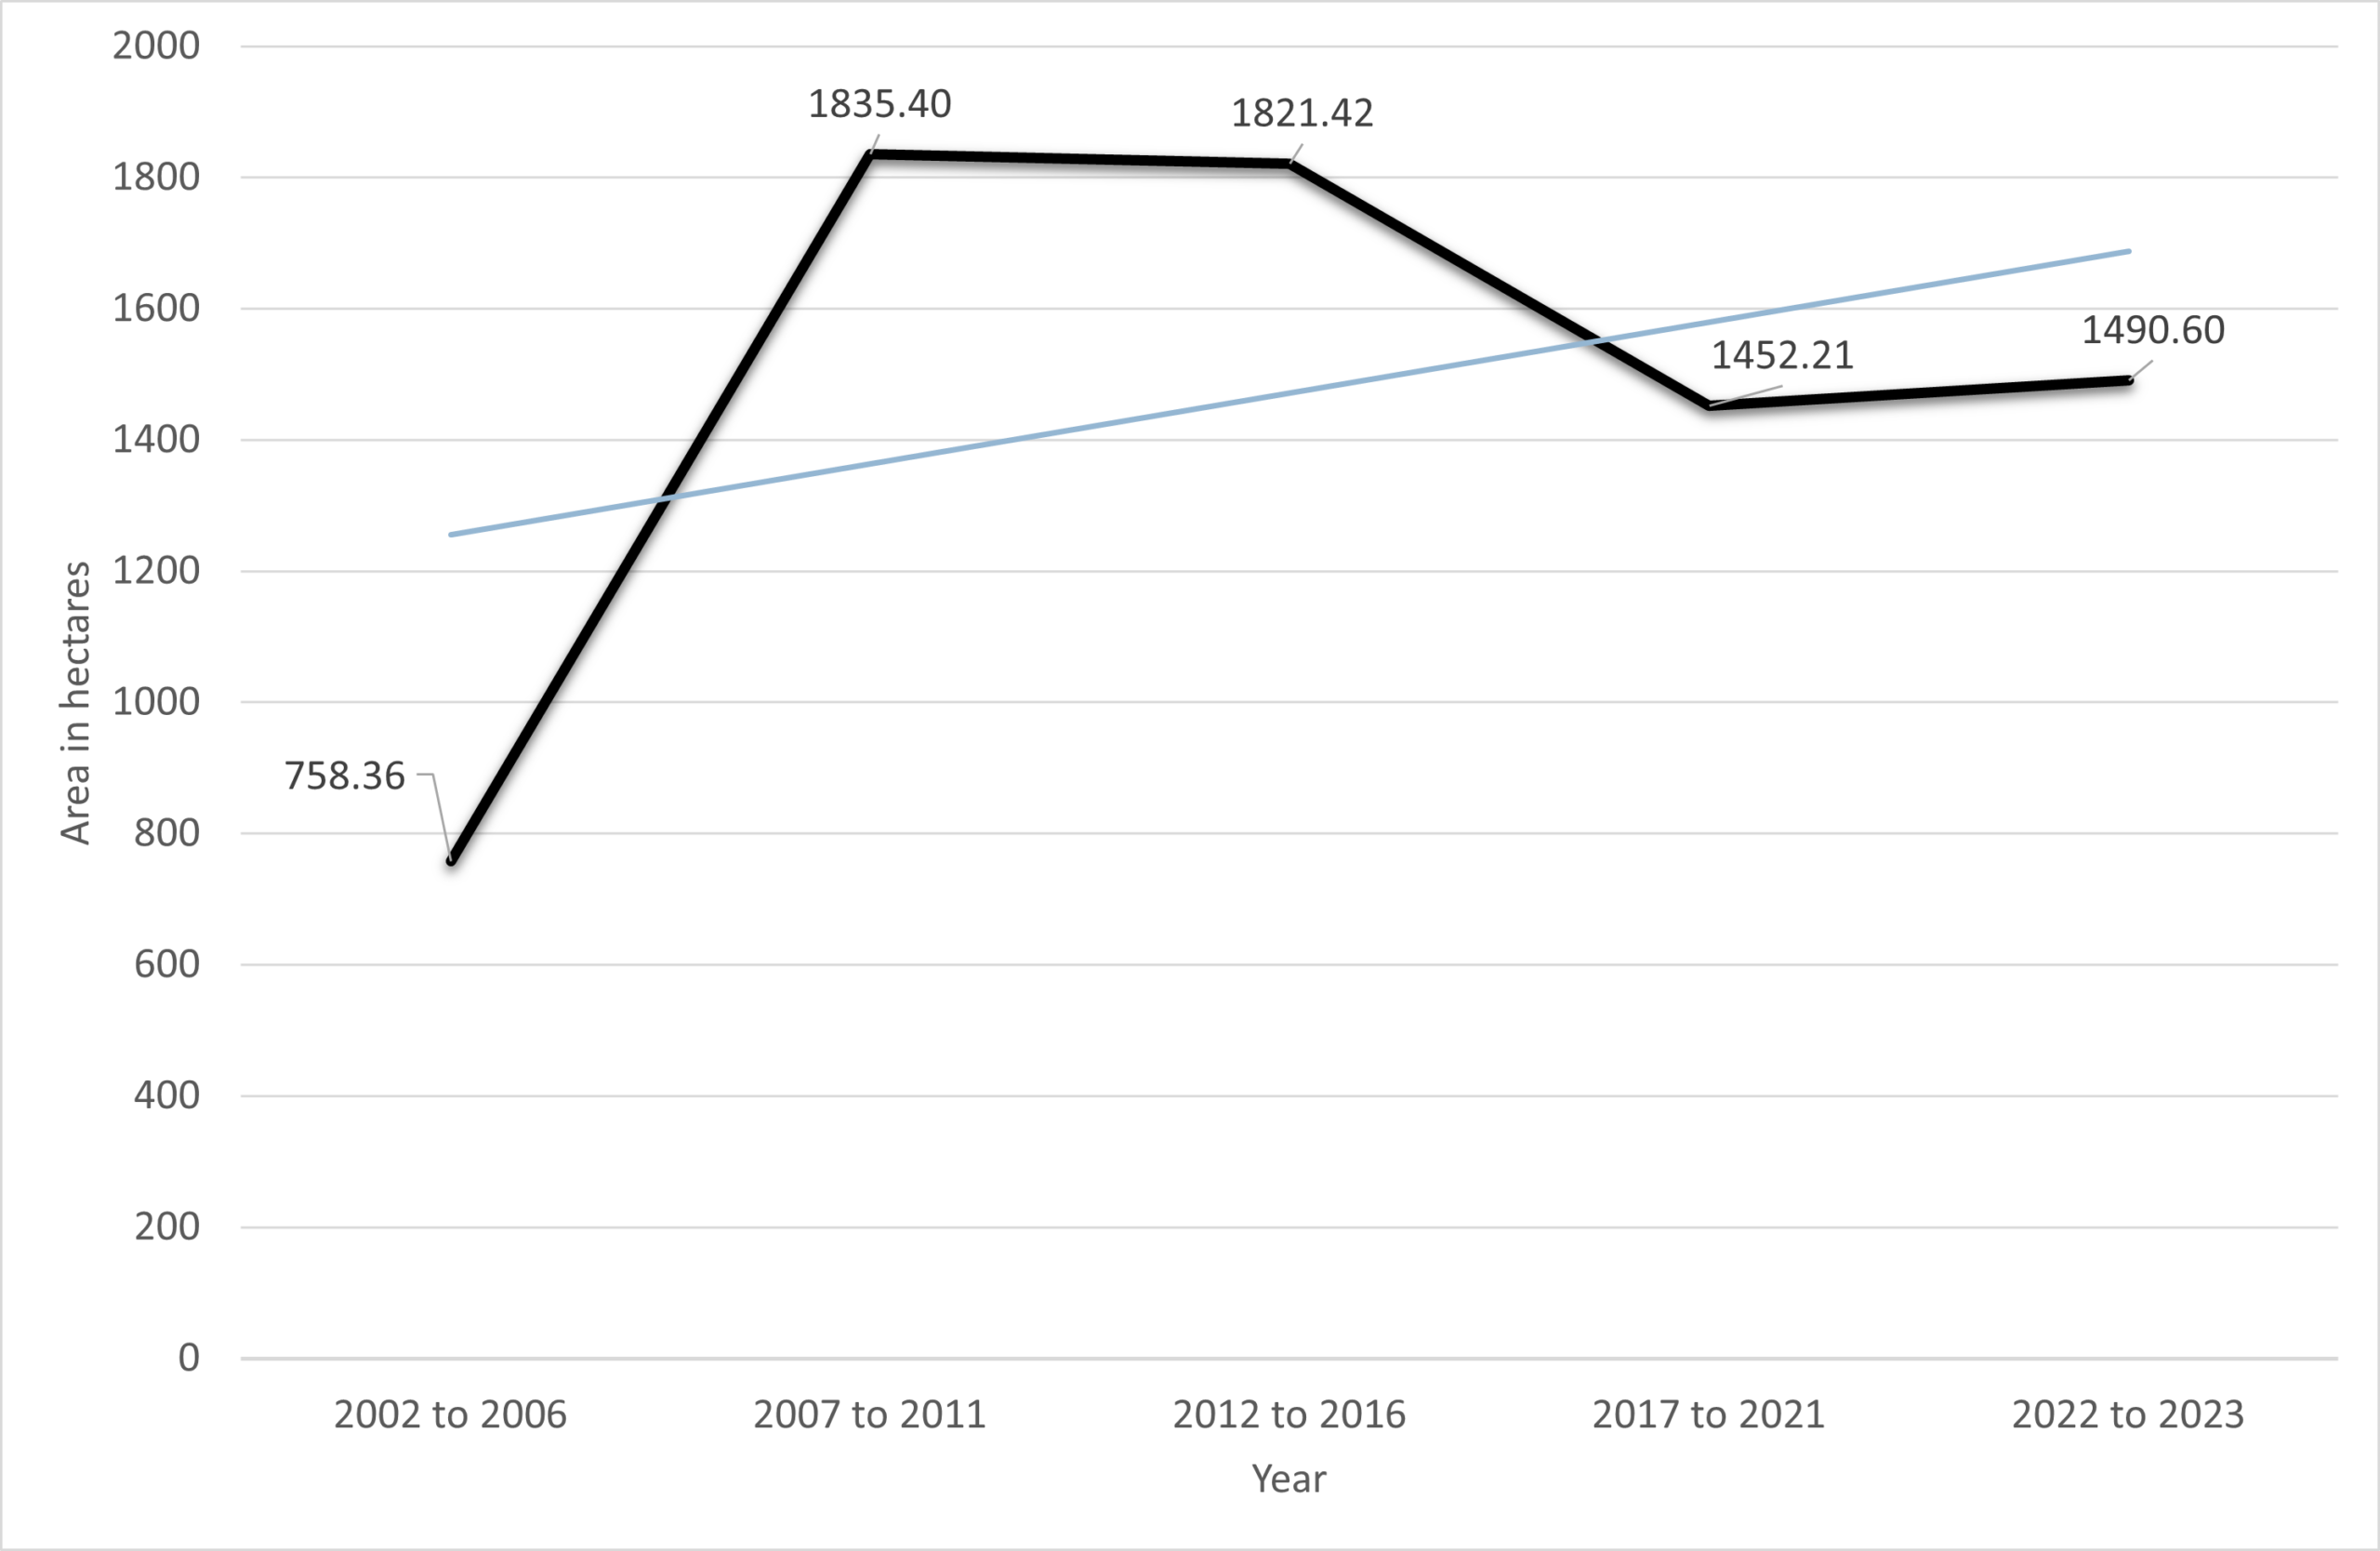
Figure 3. Average hectares per 5-year interval.
Identification of priority restoration areas
A priority restoration area can be described as an ecosystem or area that has been degraded or destroyed and its restoration would provide significant enhancement of local or regional biodiversity and/or increase the supply of necessary ecosystem services. The identification of a priority area is most often linked to a specific outcome for a site, project, program or region which are most often defined by a landowner or organization.
Several conservation organizations in Ontario have undertaken restoration area prioritization exercises to support on-the-ground efforts. Of the organizations included in this indicator, most have performed some type of prioritization exercise to help guide decision-making related to their conservation work and the remaining organizations indicate that they generally work with partners who have established priorities.
While the prioritization criteria provided were varied, there was overlap and all could be placed in one of two general categories:
- improvements for species and ecosystems, and
- improvements for people.
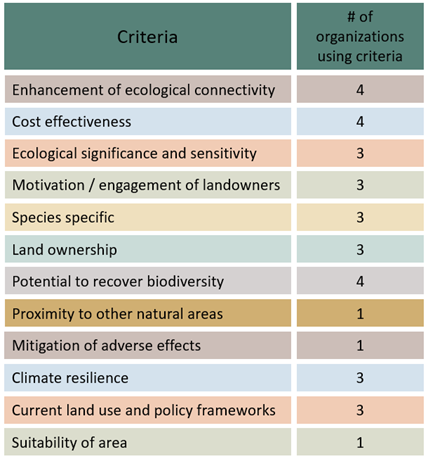
The criteria were synthesized into twelve overarching categories.
Table 1. Twelve synthesize criteria categories and the number of organizations (out of a possible 7) that indicated a criteria that fell within the overarching category.
Several tools have been developed to support the identification of priority restoration areas within Ontario. One of these tools is showcased as feature story: priority restoration identification tool developed by Dr. Richard Feldman (Ministry of Natural Resources).
Note: This indicator replaces ‘Observed Change in Land Area With Stewardship Activities’ as the stewardship activities identified within this indicator are now scoped as restoration activities.
Status
- There has been an increase in the area under restoration and stewardship in Ontario through the time period of 2002 and 2023. The degree of this increase is low to moderate.
- There has been annual variability over time in the amount of land being restored and stewarded in Ontario. This variation is likely influenced by many different factors (e.g., funding, resources, priorities, information, incentives, etc.).
- Most organizations surveyed for this indicator (6 out of 7) have undertaken a restoration area prioritization exercise or have embedded priorities within their overarching goals and objectives.
- Information and tools to support planning and prioritization of restoration areas in Ontario are being developed.
Last Updated: January 16, 2026