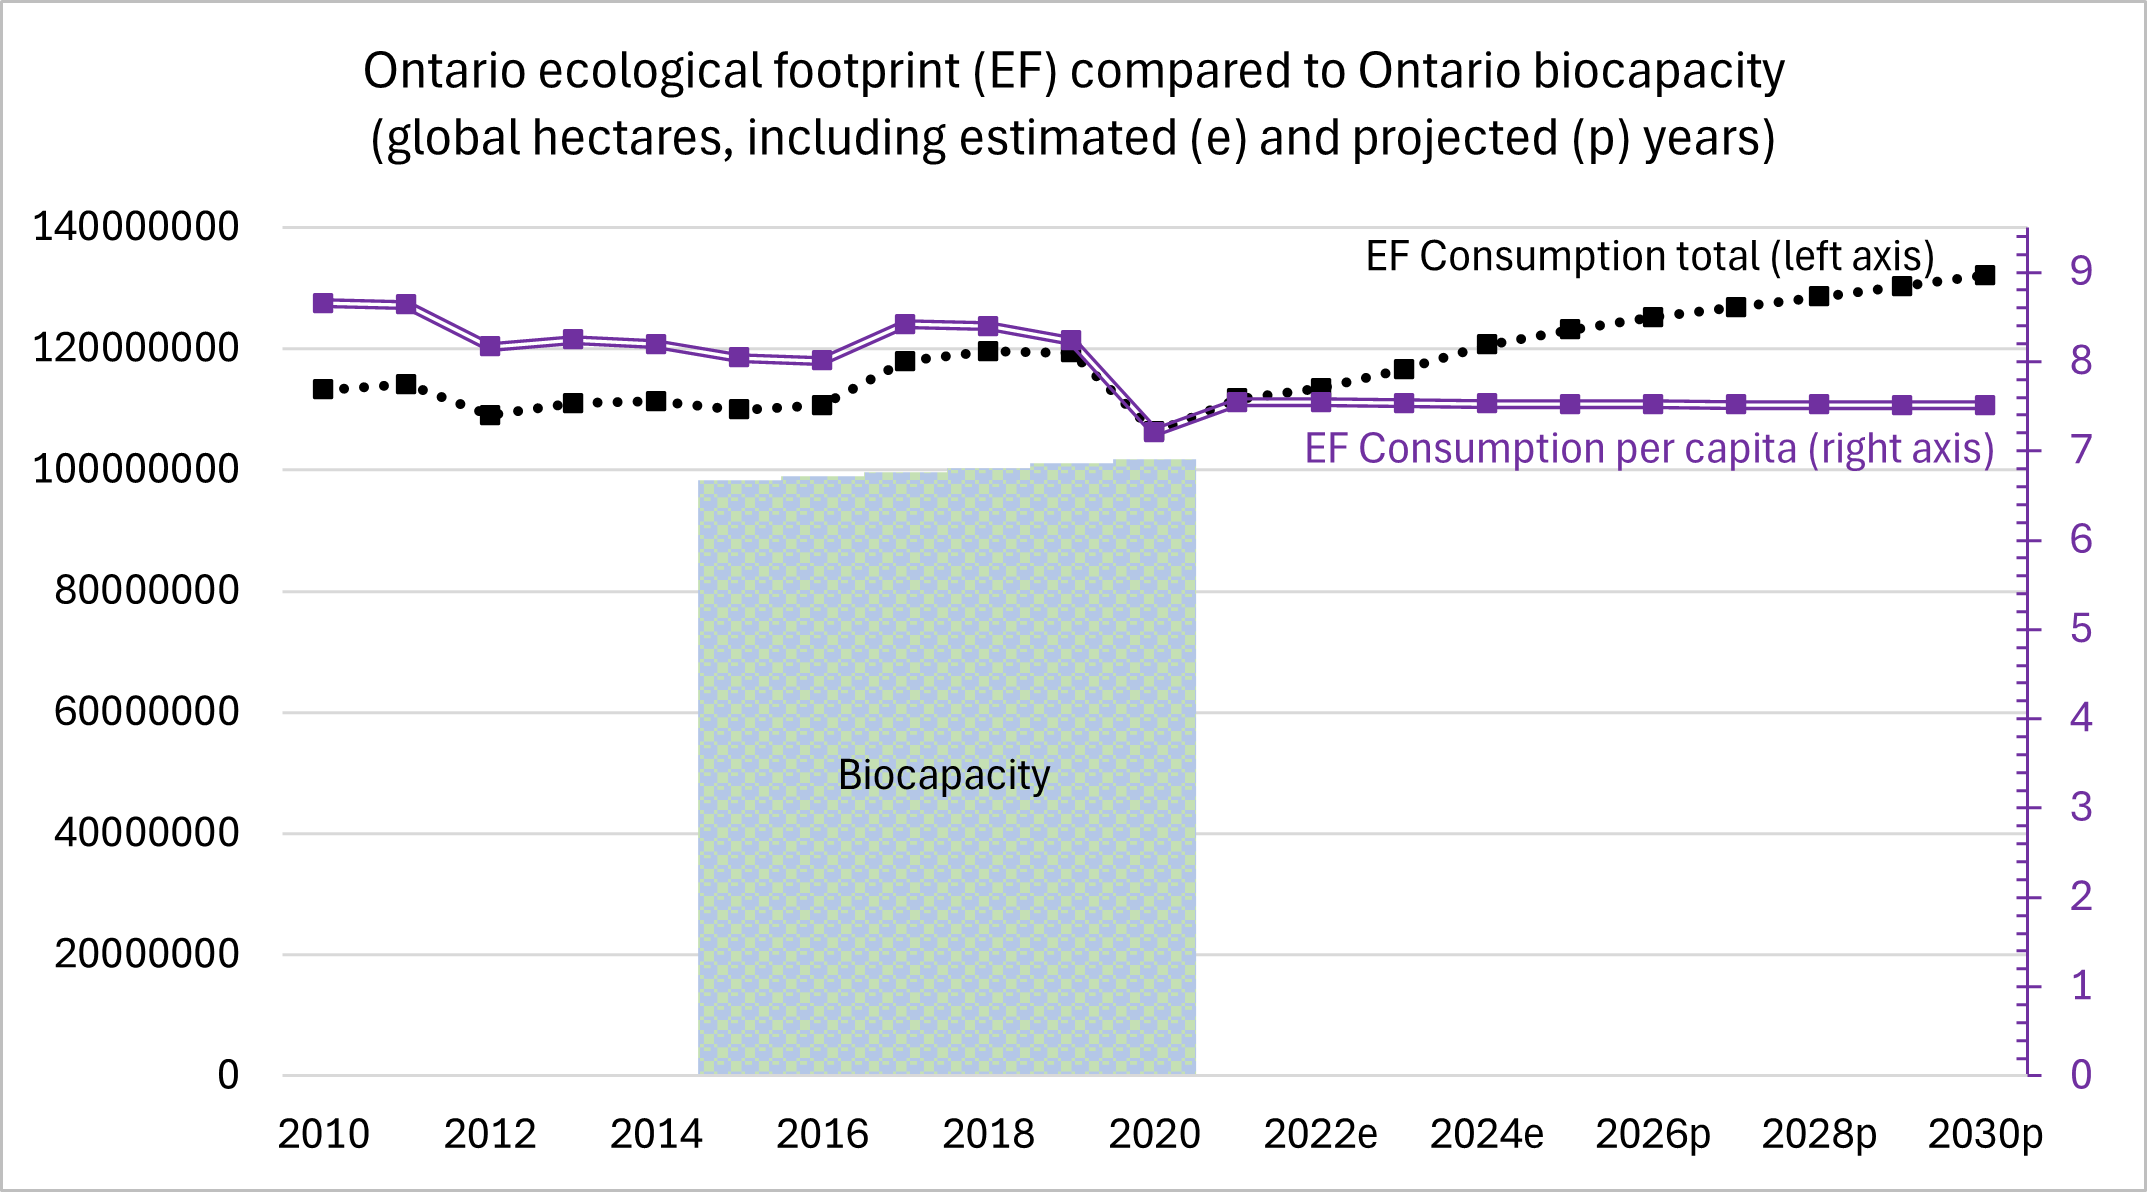
Figure 1 presents the trend in ecological footprint of consumption in Ontario since 2010 with a projection to 2030. Ecological footprint of consumption reached a high of 119.6 million global hectares (gha) in 2018 and a low of 106.3 million gha in 2020 at the onset of the covid-19 pandemic and associated lockdown measures in Ontario. Footprint rebounded to 111.7 million gha in 2021 while some lockdown measures remained. Ecological footprint from 2022 to 2024 was estimated using estimated economic statistics, whereas values in prior years relied upon published statistics. Projections beyond 2024 applied the 2021 per-capita footprint to the total population as it was projected in Ontario’s Long-Term Report on the Economy 2024 (Ontario Ministry of Finance, 2024). On a per-capita basis, Ontario’s ecological footprint of consumption declined from a high of 8.7 gha in 2010 to a low of 7.2 gha in 2020, rebounding to 7.5 gha in 2021.
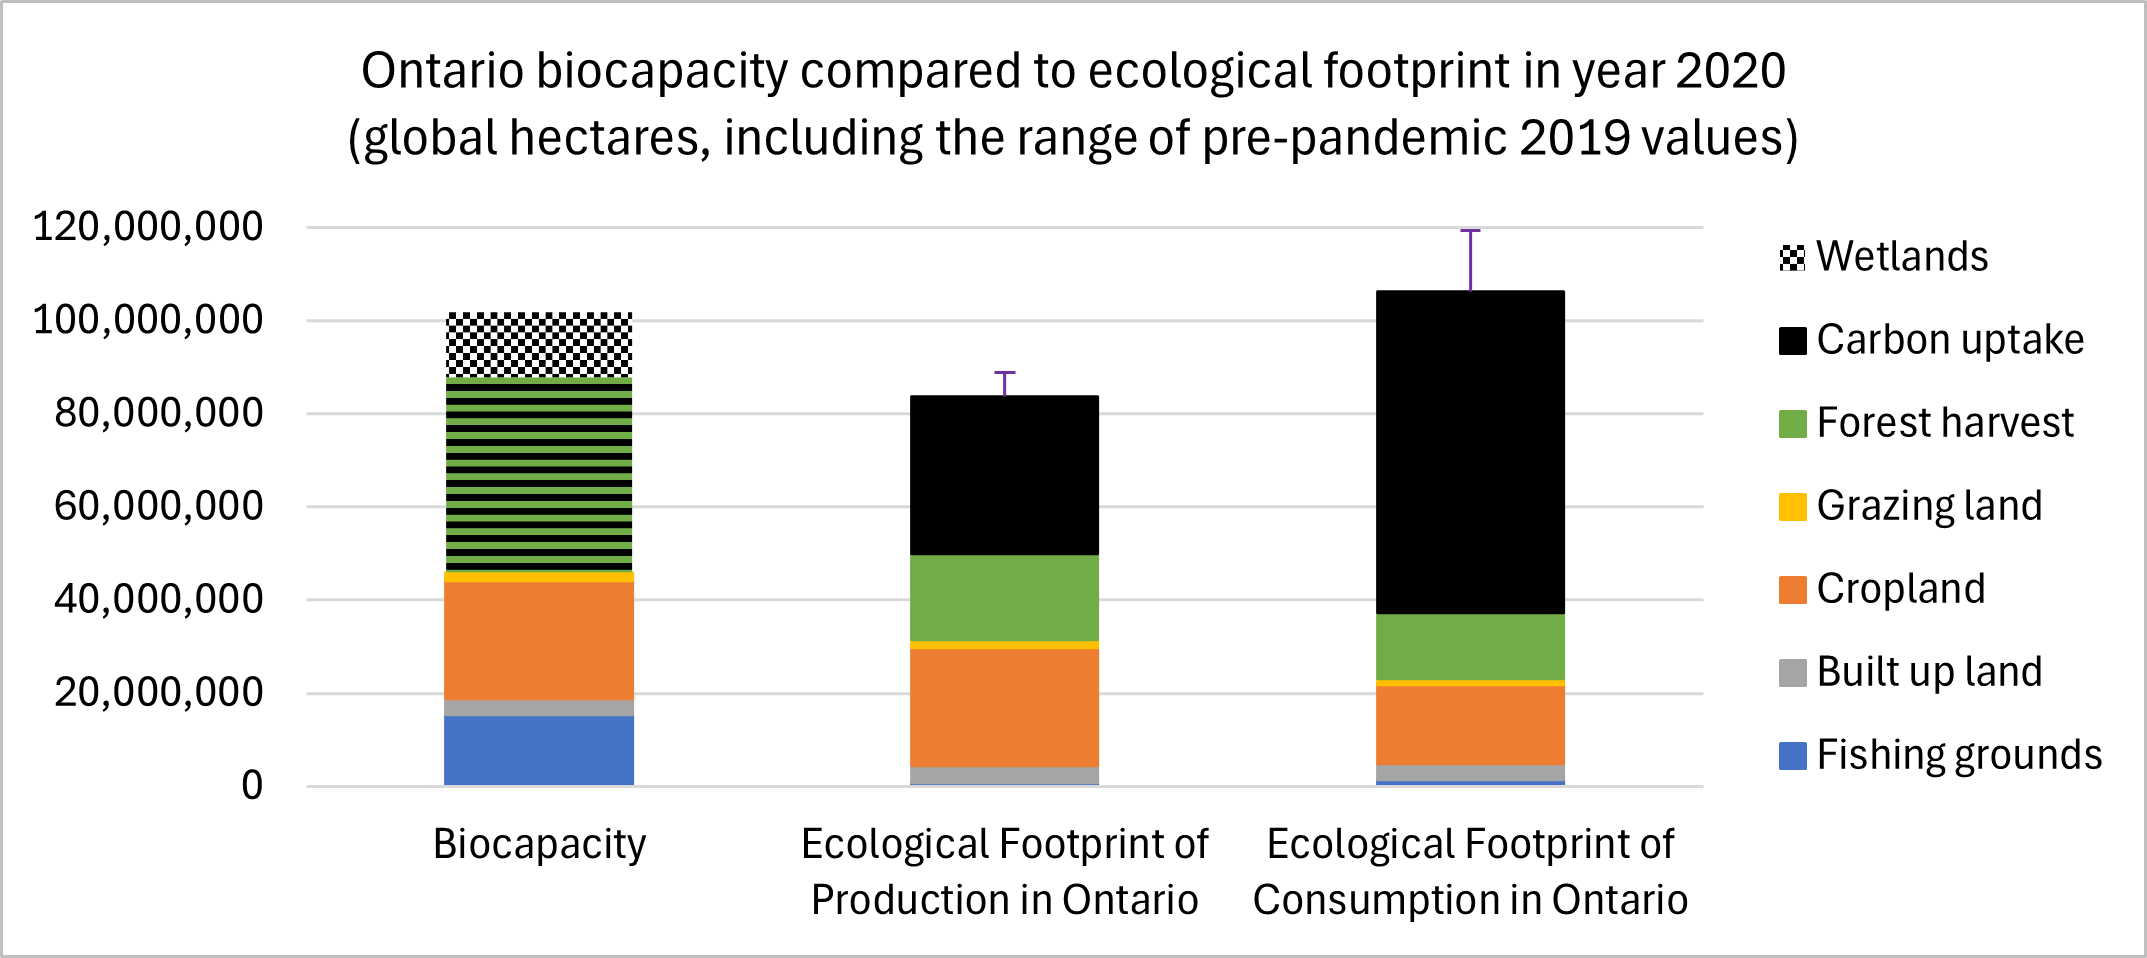 Figure 2 compares Ontario’s ecological footprint and biocapacity in 2020, which was the most recent year of complete and confident information. However, 2020 was the start of the covid-19 pandemic in Ontario with lockdown measures which significantly affected ecological footprint in that year, when compared against other years (Figure 1). For this reason, Figure 2 includes a range set to 2019 totals. Ontario’s ecological footprint of consumption was greater than biocapacity, while ecological footprint of production was smaller. Forests provided the greatest amount of biocapacity, followed by cropland. Wetlands provided a significant amount of biocapacity, reflecting its large geographic extent even though its yield was relatively small on a per-unit-area basis. Cropland provided the highest intensity of biocapacity on a per-unit-area basis. Fishing grounds provided high yields of caught and farmed fish over a relatively small portion of inland waters, thereby supporting a footprint that was much smaller than biocapacity.
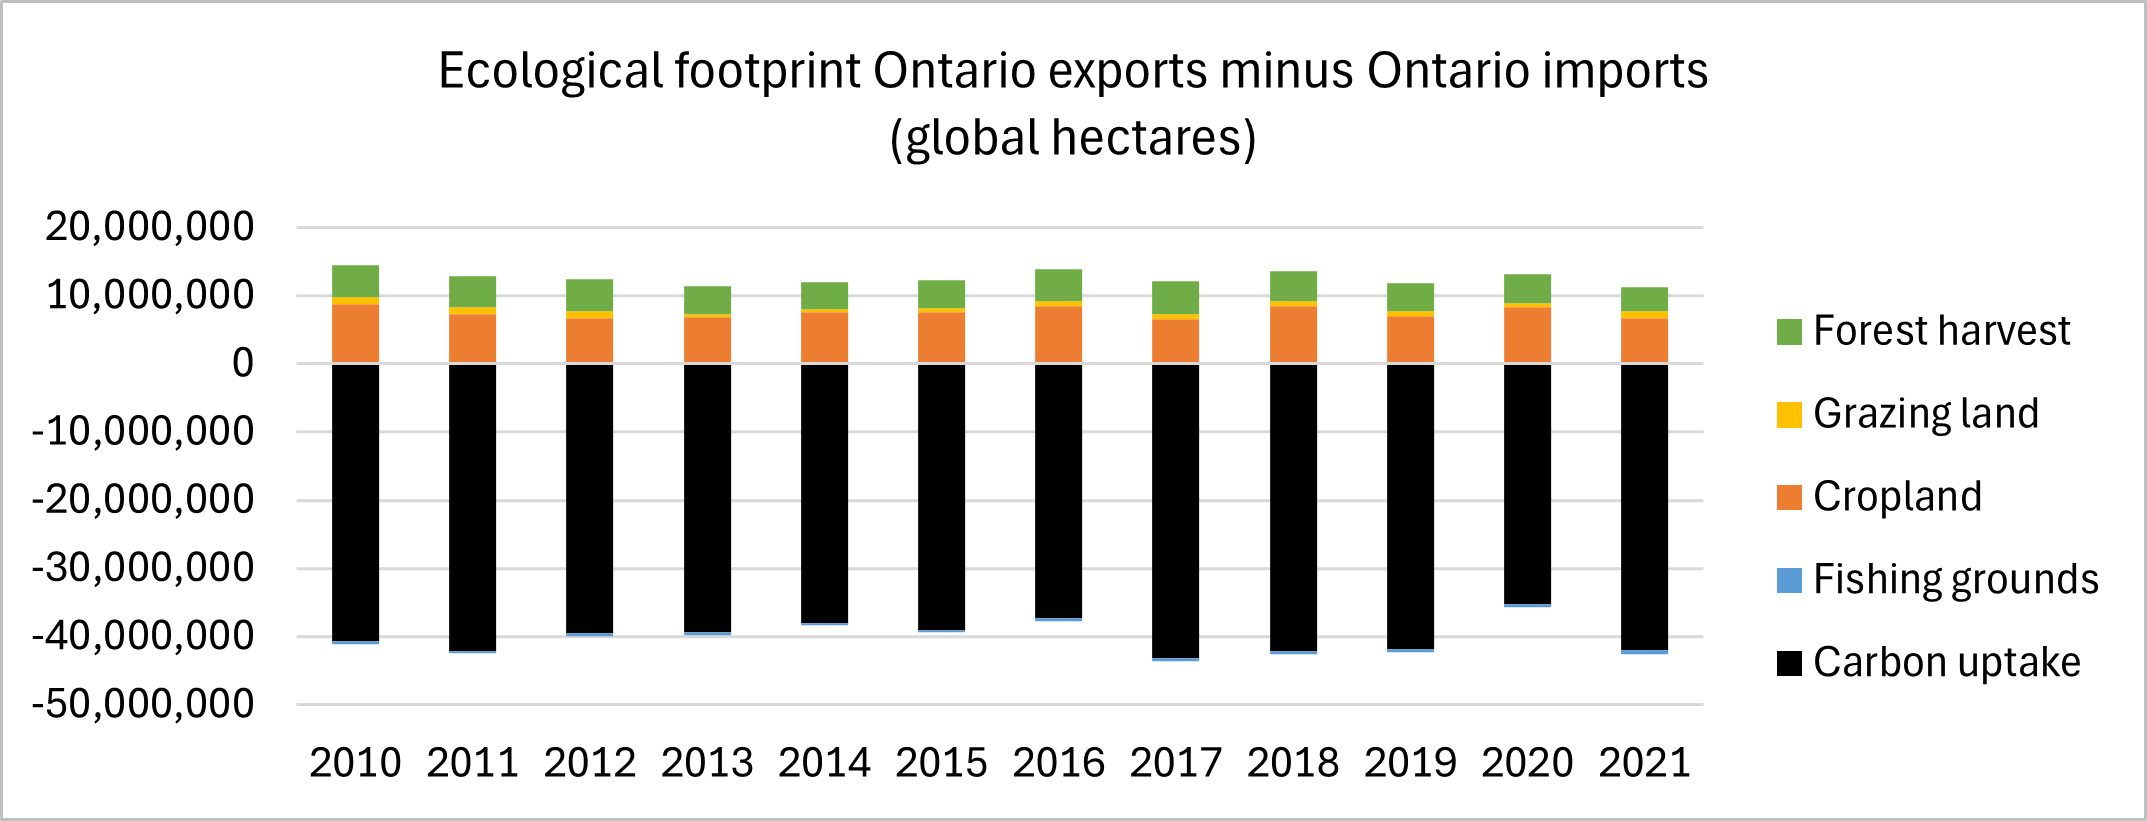
Figure 3 illustrates the trend in Ontario’s ecological footprint of exports minus ecological footprint of imports from 2010 to 2021, which was between Ontario and other provinces or other countries. These flows equate to the difference between Ontario’s ecological footprint of consumption and ecological footprint of production. On a net basis, Ontario was overall reliant upon biocapacity from outside of its boundaries to support domestic consumption. Ontario was a net importer of carbon-intensive products, such that the carbon footprint of imports was greater than exports. On a net basis, the rest of the world relied upon Ontario’s cropland, grazing land, and forest harvest biocapacity, such that the footprint of each of these components was greater for exports than imports.
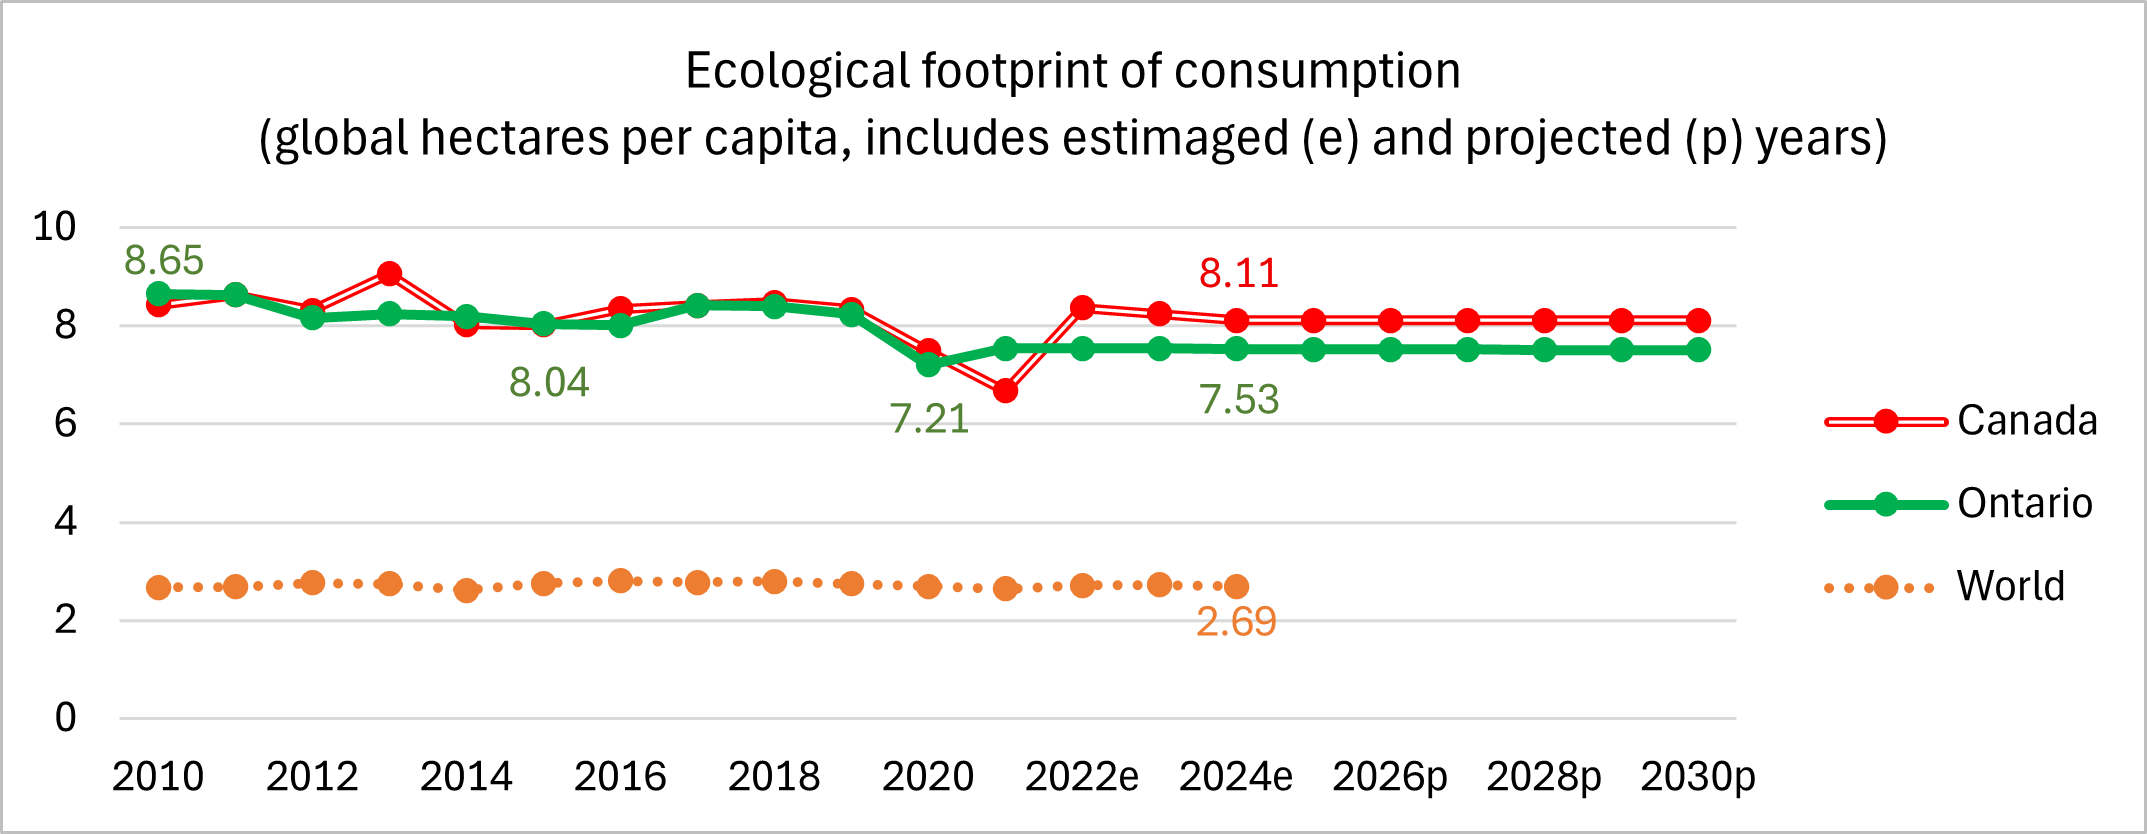
Figure 4 reveals that Ontario’s per-capita ecological footprint was very high in a world context, while it was mostly below the Canadian average after 2010. In 2024, Ontario’s estimated average per-per capita ecological footprint of consumption was almost three times as high as the average of all of humanity. Compared to national per-capita averages in 2024, Ontario’s ecological footprint was greater than 84% of countries having 99% of humanity. Ontario’s per-capita average was greater than the average in the United States of America.
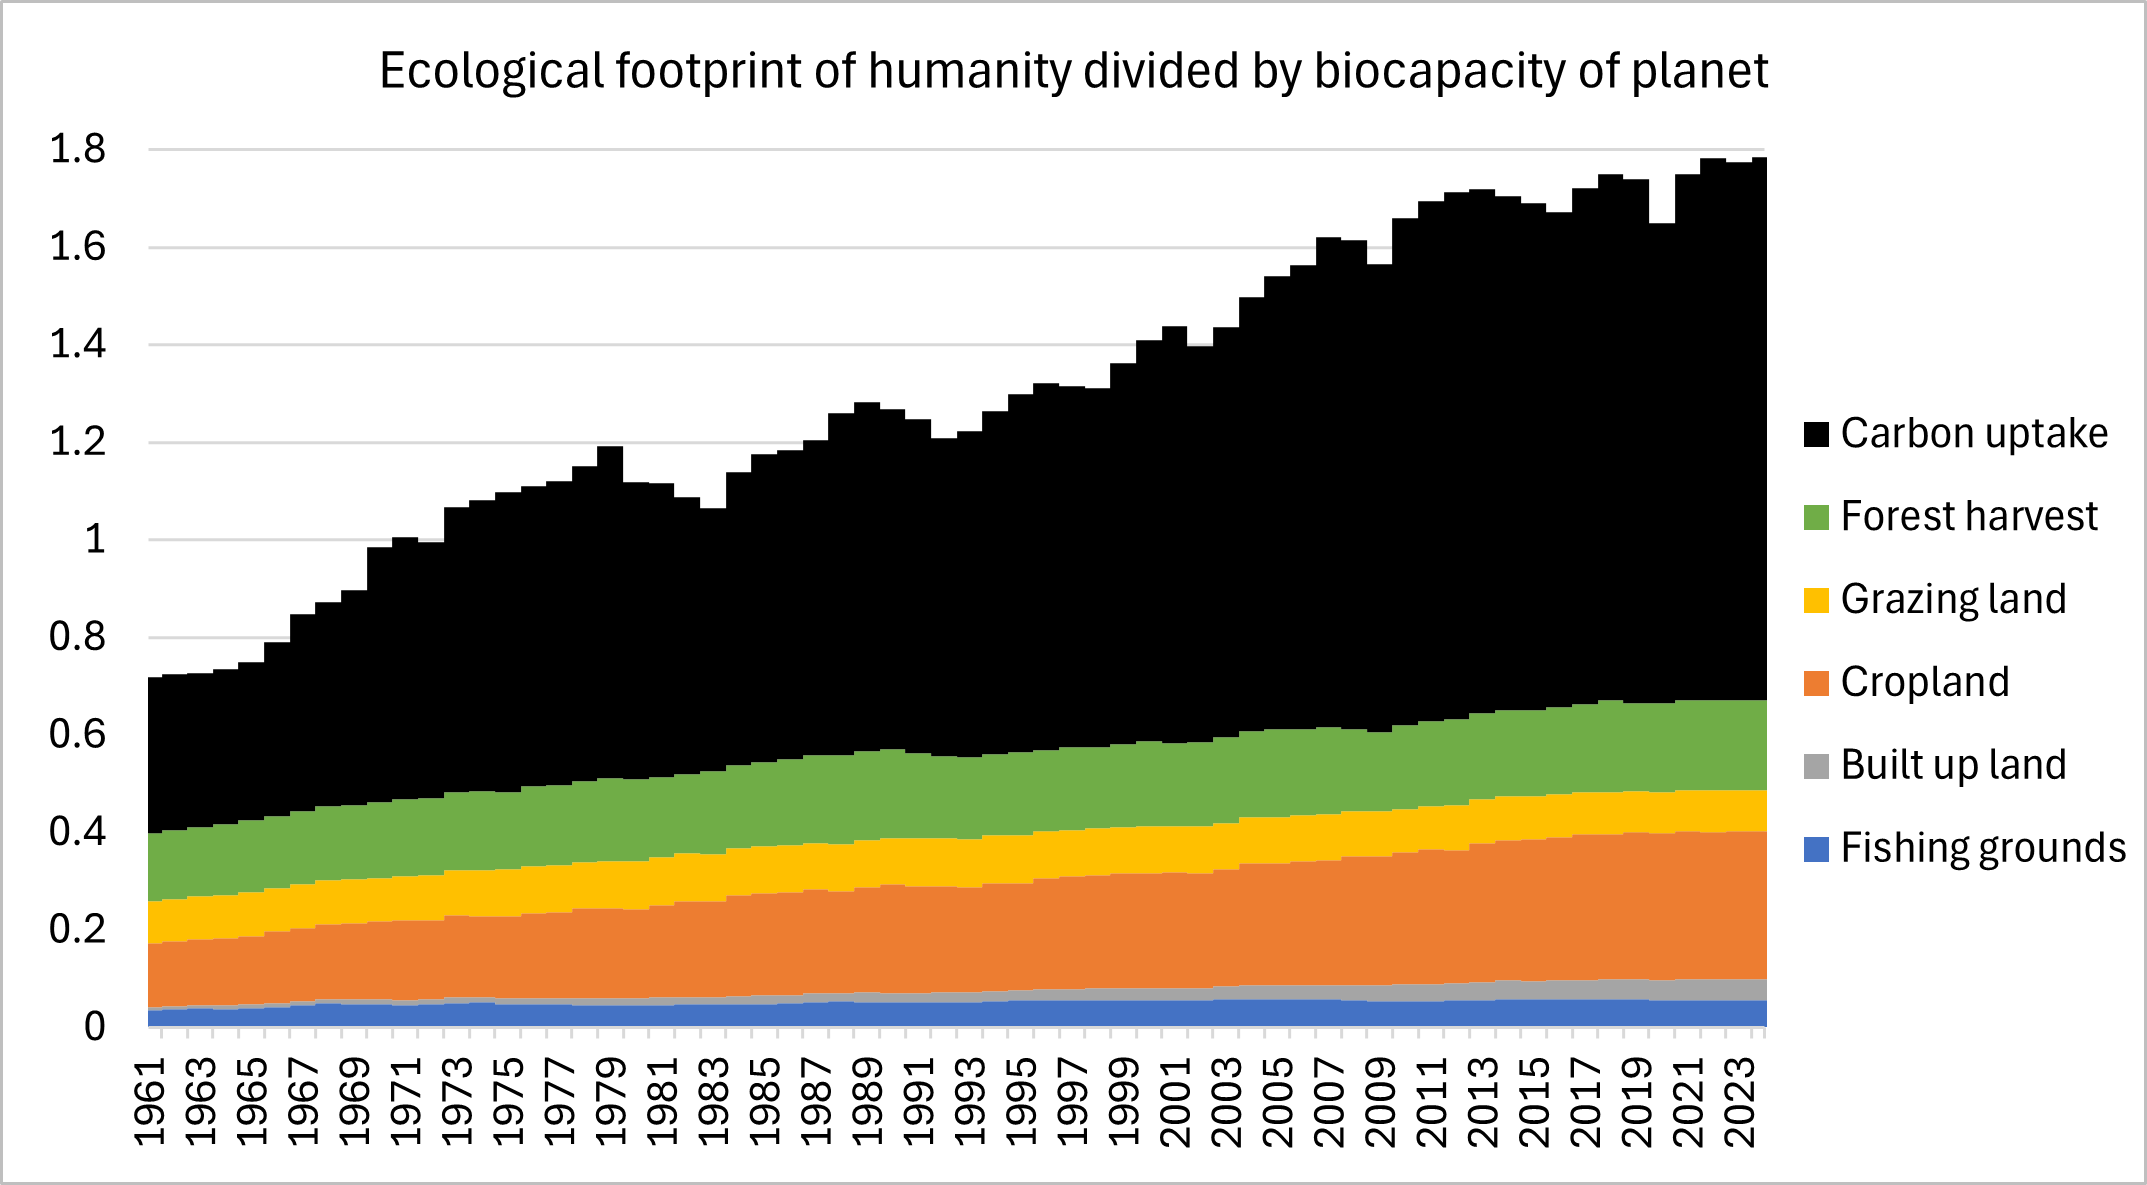
Figure 5 reveals that humanity’s total ecological footprint has exceeded biocapacity since the 1970s. In 2024, humanity’s ecological footprint was about 78% greater than planetary biocapacity, representing significant ecological footprint overshoot. Reducing overshoot is an important way of reducing human pressures on biodiversity while also striving to reach net zero emissions. Net zero emissions necessitate that humanity’s carbon footprint would be no greater than the amount of biocapacity available to sequester emissions in that year, beyond the biocapacity used in that same year for cropland, grazing land, fishing grounds, built-up land, and forest products. Many proposals that could contribute towards net zero emissions involve changes in land use and (or) land cover, which can relate to trade-offs between the carbon uptake component and other components of footprint. Proposals to use more biofuels as a substitute for fossil fuels could use more cropland, proposals to use renewable carbon-sequestering forest products as a substitute for non-renewable metals and concrete could require more forest harvest, while afforestation often involves a trade-off between using lands suitable for cropland or grazing land.
Status:
- Since 2010, Ontario’s ecological footprint of consumption has declined on a per-capita basis, while it increased on a population-total basis. For this reason, the trend is mixed.
- Ontario’s ecological footprint of consumption exceeded biocapacity in every year since 2010. Ecological footprint has tended to be more variable than biocapacity.
- On a per-capita basis, Ontario’s ecological footprint of consumption declined from a high of 8.7 global hectares (gha) in 2010 to a low of 7.2 gha in 2020, rebounding to 7.5 gha in 2021.
- On a population-total basis, Ontario’s ecological footprint increased from 113.2 million global hectares (gha) in 2010 to a high of 119.6 million gha in 2019, falling to a low of 106.3 million gha in 2020, before rebounding to 111.7 million gha in 2021.
- Ontario’s biocapacity was 101.7 million gha in 2020, an increased of about 3% from 2015. This was mostly from increases in cropland biocapacity related to changes in crops, cropped area, and yield. Biocapacity of fishing grounds also increased, from increasing aquaculture yields, while the biocapacity of other components decreased.
- Data confidence is medium reflecting different levels of confidence over the reporting timeline. As of spring 2025, year 2020 was the most recent year of complete and confident information about Ontario’s biocapacity. Land cover information was not available after 2020, which limited confidence in extending 2020 values to more recent years. Measures of ecological footprint after 2021 provide less confidence than prior-year measures which were derived from reported economic statistics. Ecological footprint in 2020 was significantly below values in 2019 and 2021 reflecting a significant temporary drop in consumption at the start of the covid-19 pandemic and the peak of associated lockdown measures in Ontario. For this reason, a timeline of data about ecological footprint is more representative than a snapshot of only year 2020 values.
- Ontario is challenged to meet Target 8. Under business-as-usual trends, by 2030 Ontario is unlikely to have reduced its per-capita ecological footprint by 23% which would be needed to have its total be within the most recent measure of biocapacity in 2020 applied to projected population growth in Ontario. Even if Ontario’s biocapacity were to increase from 2020 to 2030 at the same 3% rate that it increased from 2015 to 2020, there would still be a significant gap.
Previous versions:
Indicator – Ontario’s Ecological Footprint and Biocapacity 2021
Indicator – Ontario’s Ecological Footprint and Biocapacity_May 2015
Human activities affect biodiversity directly through habitat loss, introduction of invasive species, pollution, unsustainable use, and climate change. The number of humans and their average level of consumption combine to drive these threats and often compromise the ability of ecosystems to provide ecosystem goods and services, such as timber and the sequestration of carbon. A necessary condition to sustain humanity’s use of biological resources is to harvest renewable resources at rates that can be regenerated, and to emit wastes at rates that can be metabolized. These necessary conditions can be evaluated by measuring ecological footprint and biocapacity.
Ecological footprint is the area of land and water needed on an annual basis to provide food, forest products, settled areas, and sequestration of carbon emissions from burning fossil fuels and commercial biomass. Ecological footprint is measured as sum of several components: built-up land occupied by human settlements, plus cropland used for food and fibres and animal feed, plus pasture used as grazing land to supplement animal feed, plus the area of inland and marine fishing grounds used for farmed or wild-caught fish and aquatic plants, plus the area of forest harvest used for wood and pulp products, plus terrestrial carbon uptake measured as the area of additional forests that would be needed to sequester carbon emissions beyond the proportion sequestered by the world’s oceans.
Ecological footprint can be compared to biocapacity, which quantifies the potential of specific lands and waters to support ecological footprint. Biocapacity is measured as the sum of the same components of built-up land, cropland, grazing land, fishing grounds, plus the broader category of forest biocapacity (supporting forest harvest or forest carbon uptake), plus the Ontario-specific component of wetland biocapacity providing carbon uptake measured as the (smaller) equivalent area of forest carbon uptake.
Ecological footprint and biocapacity are measured in the same units of global hectares, which are local hectares adjusted to a globally standardized and equivalent unit. Footprint and biocapacity can be compared to inform measures of sustainability and human pressures on ecosystems and biodiversity. This comparison is human-centered because both measures only relate to human uses of ecosystems. Yet this comparison also infers human pressures on ecosystems and biodiversity that are not used by humans.
Ecological footprint is widely recognized as a measure of sustainability used by governments and institutes worldwide. Ecological footprint has been used as an indicator at the global level to assess progress on the Aichi Biodiversity Targets (Secretariat of the Convention on Biological Diversity 2014), and to measure performance under the Kunming-Montreal Global Biodiversity Framework (United Nations Environment Program, 2022). Although ecological footprint does not measure biodiversity loss directly, it tracks global pressures on biodiversity and can be used to complement other measures of ecosystem-specific impacts on biodiversity (Galli et al. 2014). A strength of ecological footprint is that it makes a direct comparison between renewable resource availability and consumption and looks at total human demand on global ecosystems rather than a limited view of the sustainable use of a single commodity, or a single component such as a carbon footprint.
Since the 1970s, humanity has been in ecological overshoot, meaning that annual demand has exceeded what Earth can regenerate. Global ecological overshoot has major environmental implications, including degradation of ecological assets, depletion of natural reserves, biodiversity loss, and ecosystem collapse. While discrete threats to biodiversity can be identified (e.g. the loss of forest habitat to urban development), the overall unsustainable use of biological resources — driven by human consumption patterns, technology and population levels — represents a suite of cumulative stresses on biodiversity and is a major factor driving biodiversity loss.
This indicator relates to trends in Ontario’s ecological footprint and biocapacity assessed in 2025 (Miller et al., 2025) using the most recent data about land cover/use, harvests, emissions, and economic statistics related to production, consumption, and trade. This analysis was undertaken by York University Ecological Footprint Initiative which also produces National Ecological Footprint and Biocapacity Accounts of all countries and the world, and which has researched ecological footprint and biocapacity at other scales including cities, communities, and institutions. This Ontario assessment builds on prior research from Miller et al. (2021), Zokai et al. (2015), and Stechbart and Wilson (2010).
This indicator examines trends in Ontario’s Ecological Footprint and Biocapacity for the years 2005, 2010, and 2015 based on analysis completed by the York University Ecological Footprint Initiative in partnership with the Global Footprint Network. See the full report here.
Data used to derive Ontario’s ecological footprint and biocapacity were sourced from Ontario Ministry of Natural Resources (including Ontario GeoHub), Statistics Canada, Natural Resources Canada, and Department of Fisheries and Oceans Canada. These data were integrated with international statistics from the 2025 edition of National Ecological Footprint and Biocapacity Accounts (Lo et al., 2025) to derive Ontario’s ecological footprint and biocapacity in globally standardized and comparable units of global hectares, following an established scaling methodology. International data was sourced from International Energy Agency (IEA), Food and Agriculture Organization (FAO) of the United Nations (and its PopStat, ProdStat, TradeStat, ResourceStat, and FishStat databases), Sea Around Us, UN COMTRADE, CORINE Land Cover, Global Agro-Ecological Zones (GAEZ), Global Land Cover (GLC), Global Carbon Budget, Carbon Dioxide Information Analysis Center (CDIAC-FF), World Bank, International Monetary Fund, and Penn World Tables.
Ecological footprint was the sum of several footprint components consistent with the framework of National Ecological Footprint and Biocapacity Accounts. The components of fishing grounds, cropland, grazing land, and forest harvest were derived as the sum of product-specific footprints, by relating their mass of product (e.g. tonnes of plywood) to a mass of harvest (e.g. tonnes of softwood logs), then dividing by its yield or the yield of its parent product (e.g. tonnes of softwood logs per hectare of harvested forest), then multiplied by yield factors and an equivalence factor.
The carbon uptake component of ecological footprint was derived as the mass of carbon emissions minus the portion sequestered by the world’s oceans, with the result divided by the average rate of carbon sequestration per hectare of forest, then multiplied by yield factors and an equivalence factor.
Built-up land footprint was derived as built-up area multiplied by factors which were used to generate the cropland component, following the usual methodology of assuming that built-up land occupied land that could have otherwise yielded agricultural products.
Yield factors accounted for differences within Ontario and between Ontario and Canadian and world yields related to a specific product or component. Equivalence factors related differences in world average productivity between the various components of footprint.
Ontario biocapacity was derived by relating each unique type of Ontario land-cover/use to a set of mutually exclusive categories: fishing grounds, cropland, grazing land, forest biocapacity, and wetland biocapacity. The wetland component follows the Ontario-specific innovation previously established by Miller et al. (2021) to quantify its biocapacity as its capacity to sequester carbon. Hectares of biocapacity were multiplied by their respective yield and equivalence factors in common with ecological footprint.
Two measures of ecological footprint were derived for Ontario: ecological footprint of consumption and ecological footprint of production. Ecological footprint of consumption was equal to production plus the footprint embodied within imports minus the footprint embodied within exports. Ecological footprint of consumption relates Ontario’s consumption to pressures on global biodiversity, while ecological footprint of production relates production in Ontario to pressures upon biodiversity within Ontario.
Ecological footprint of consumption was derived using economic data from Statistics Canada, relating supply and use tables, trade flows, and economy-wide input-output relationships. Ontario’s ecological footprint of consumption was derived as the sum of built-up areas in Ontario, plus cropland harvested for domestically consumed food and cropped fibres and animal feed, plus grazing land used as pasture by domestically consumed animals and animal products, plus the area of farmed or wild-caught fishing grounds used for domestically consumed fish and aquatic plants, plus the area of forests harvested for domestically consumed pulp and wood products, plus the area needed to sequester carbon emissions attributed to domestic consumption (inclusive of the transportation of imported goods). The resulting measures of consumption and production were related to each other, and related to the differentiation between private consumption, government consumption, and investment in gross fixed capital. In addition, footprint multipliers were derived for categories of final demand to allow analysts to estimate the impacts on ecological footprint of changes in economic activity.
Year 2020 was the most recent year of complete and confident information about Ontario’s ecological footprint and biocapacity. As of spring 2025, the most recent comprehensive land cover dataset of Ontario characterized its landscapes at a 15-metre resolution in the year 2020, and its change from 2015. This was the most lagged dataset used in the assessment of ecological footprint and biocapacity, whereas harvest statistics related to forests, crops, livestock, and fish included data from more recent years. Economic statistics related to supply, use, trade, and input-output relationships which were available on a consistent basis from 2010 to 2021. Efforts were made to extend this timeline with estimates and projections of footprint to 2030.
Web Links:
Global Footprint Network http://www.footprintnetwork.org/
National Ecological Footprint and Biocapacity Accounts data https://data.footprintwork.org
York University Ecological Footprint Initiative https://footprint.info.yorku.ca
References:
Galli, A., M. Wackernagel, K. Iha, and E. Lazarus. 2014. Ecological Footprint: implications for biodiversity. Biological Conservation 173:121–132.
Lo, K., Miller, E., Dworatzek, P., Basnet, N., Silva, J., Van Berkum, J. L., Halldórsdóttir, R. B., & Dyck, M. D. R. 2025. National Ecological Footprint and Biocapacity Accounts, 2025 Edition. Data and metadata version 1.0. Produced for Footprint Data Foundation by researchers at York University and University of Iceland. Available at: https://footprint.info.yorku.ca/data/
Miller, E., A.M.M. Reeves, P. Dworatzek, and K. Lo. 2025. Ontario’s Ecological Footprint and Biocapacity as of 2025. Report submitted to Ontario Ministry of Natural Resources.
Miller, E., J. Robinson, M.-L. McMaster, E. Holloway and A. Kapoor. 2021. Ontario’s Ecological Footprint and Biocapacity: Measures and trends from 2005 to 2015. Report submitted to Ontario Ministry of Natural Resources and Forestry.
Ontario Ministry of Finance. 2024. Ontario’s Long-Term Report on the Economy 2024-46. King’s Printer for Ontario. Available at: https://www.ontario.ca/document/ontarios-long-term-report-economy-2024
Secretariat of the Convention on Biological Diversity. 2014. Global biodiversity outlook 4. Montréal, QC.
Stechbart, M., and J. Wilson. 2010. Province of Ontario Ecological Footprint and biocapacity analysis. Copyright by Global Footprint Network, Oakland, CA.
United Nations Environment Program. 2022. Decision adopted by the conference of the parties to the convention on biological diversity. 15/5. Monitoring framework for the Kunming-Montreal Global Biodiversity Framework. Convention on biological diversity. CBD/COP/DEC/15/5. 19 December 2022.
Zokai, G., J. Ortego, D. Zimmerman, and M. Wackernagel. 2015. The Footprint and Biocapacity of Ontario, Canada: comparing results for 2005 and 2010. Global Footprint Network, Oakland, CA.
