This indicator assesses alterations in stream flow variables that are important to biodiversity by examining long-term changes in the amount and timing of annual high and low flows and flow variability (flashiness) for streams across Ontario.

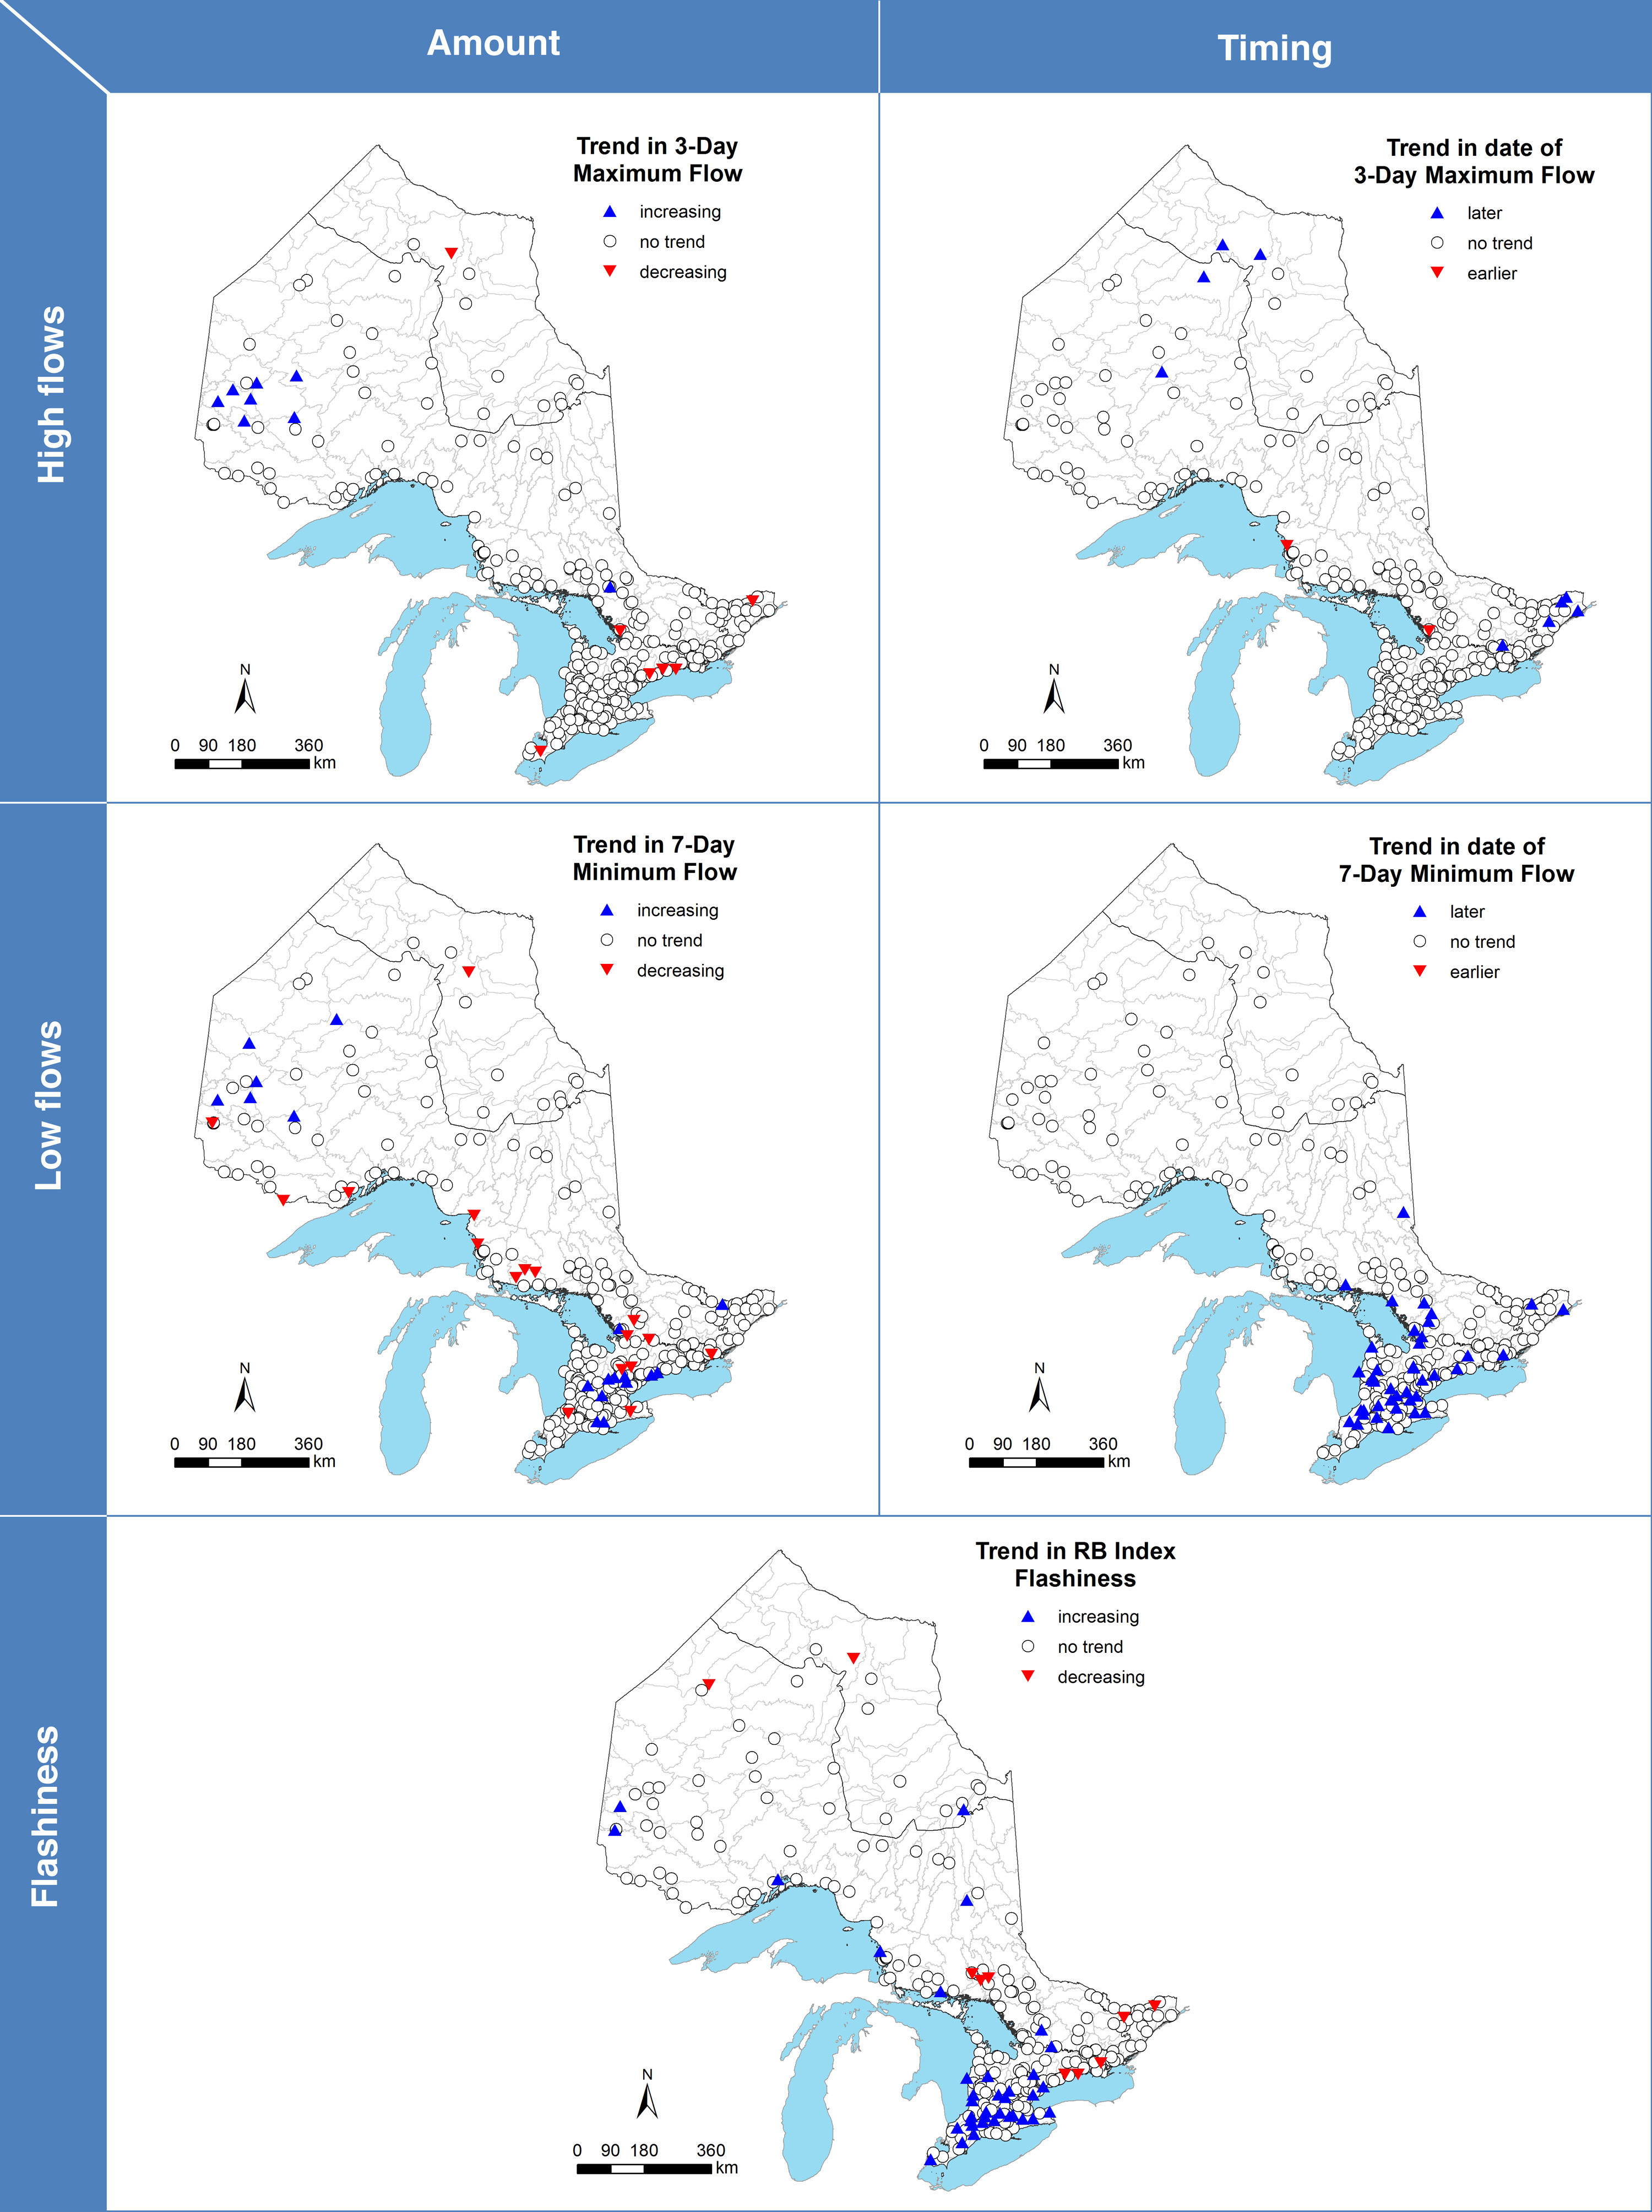
Figure 1. Significant trends in the amount and timing of high and low flows and flashiness for 274 Ontario stream flow stations over the period 1981-2010.
Figure 1. Significant trends in the amount and timing of high and low flows and flashiness for 274 Ontario stream flow stations over the period 1981-2010.

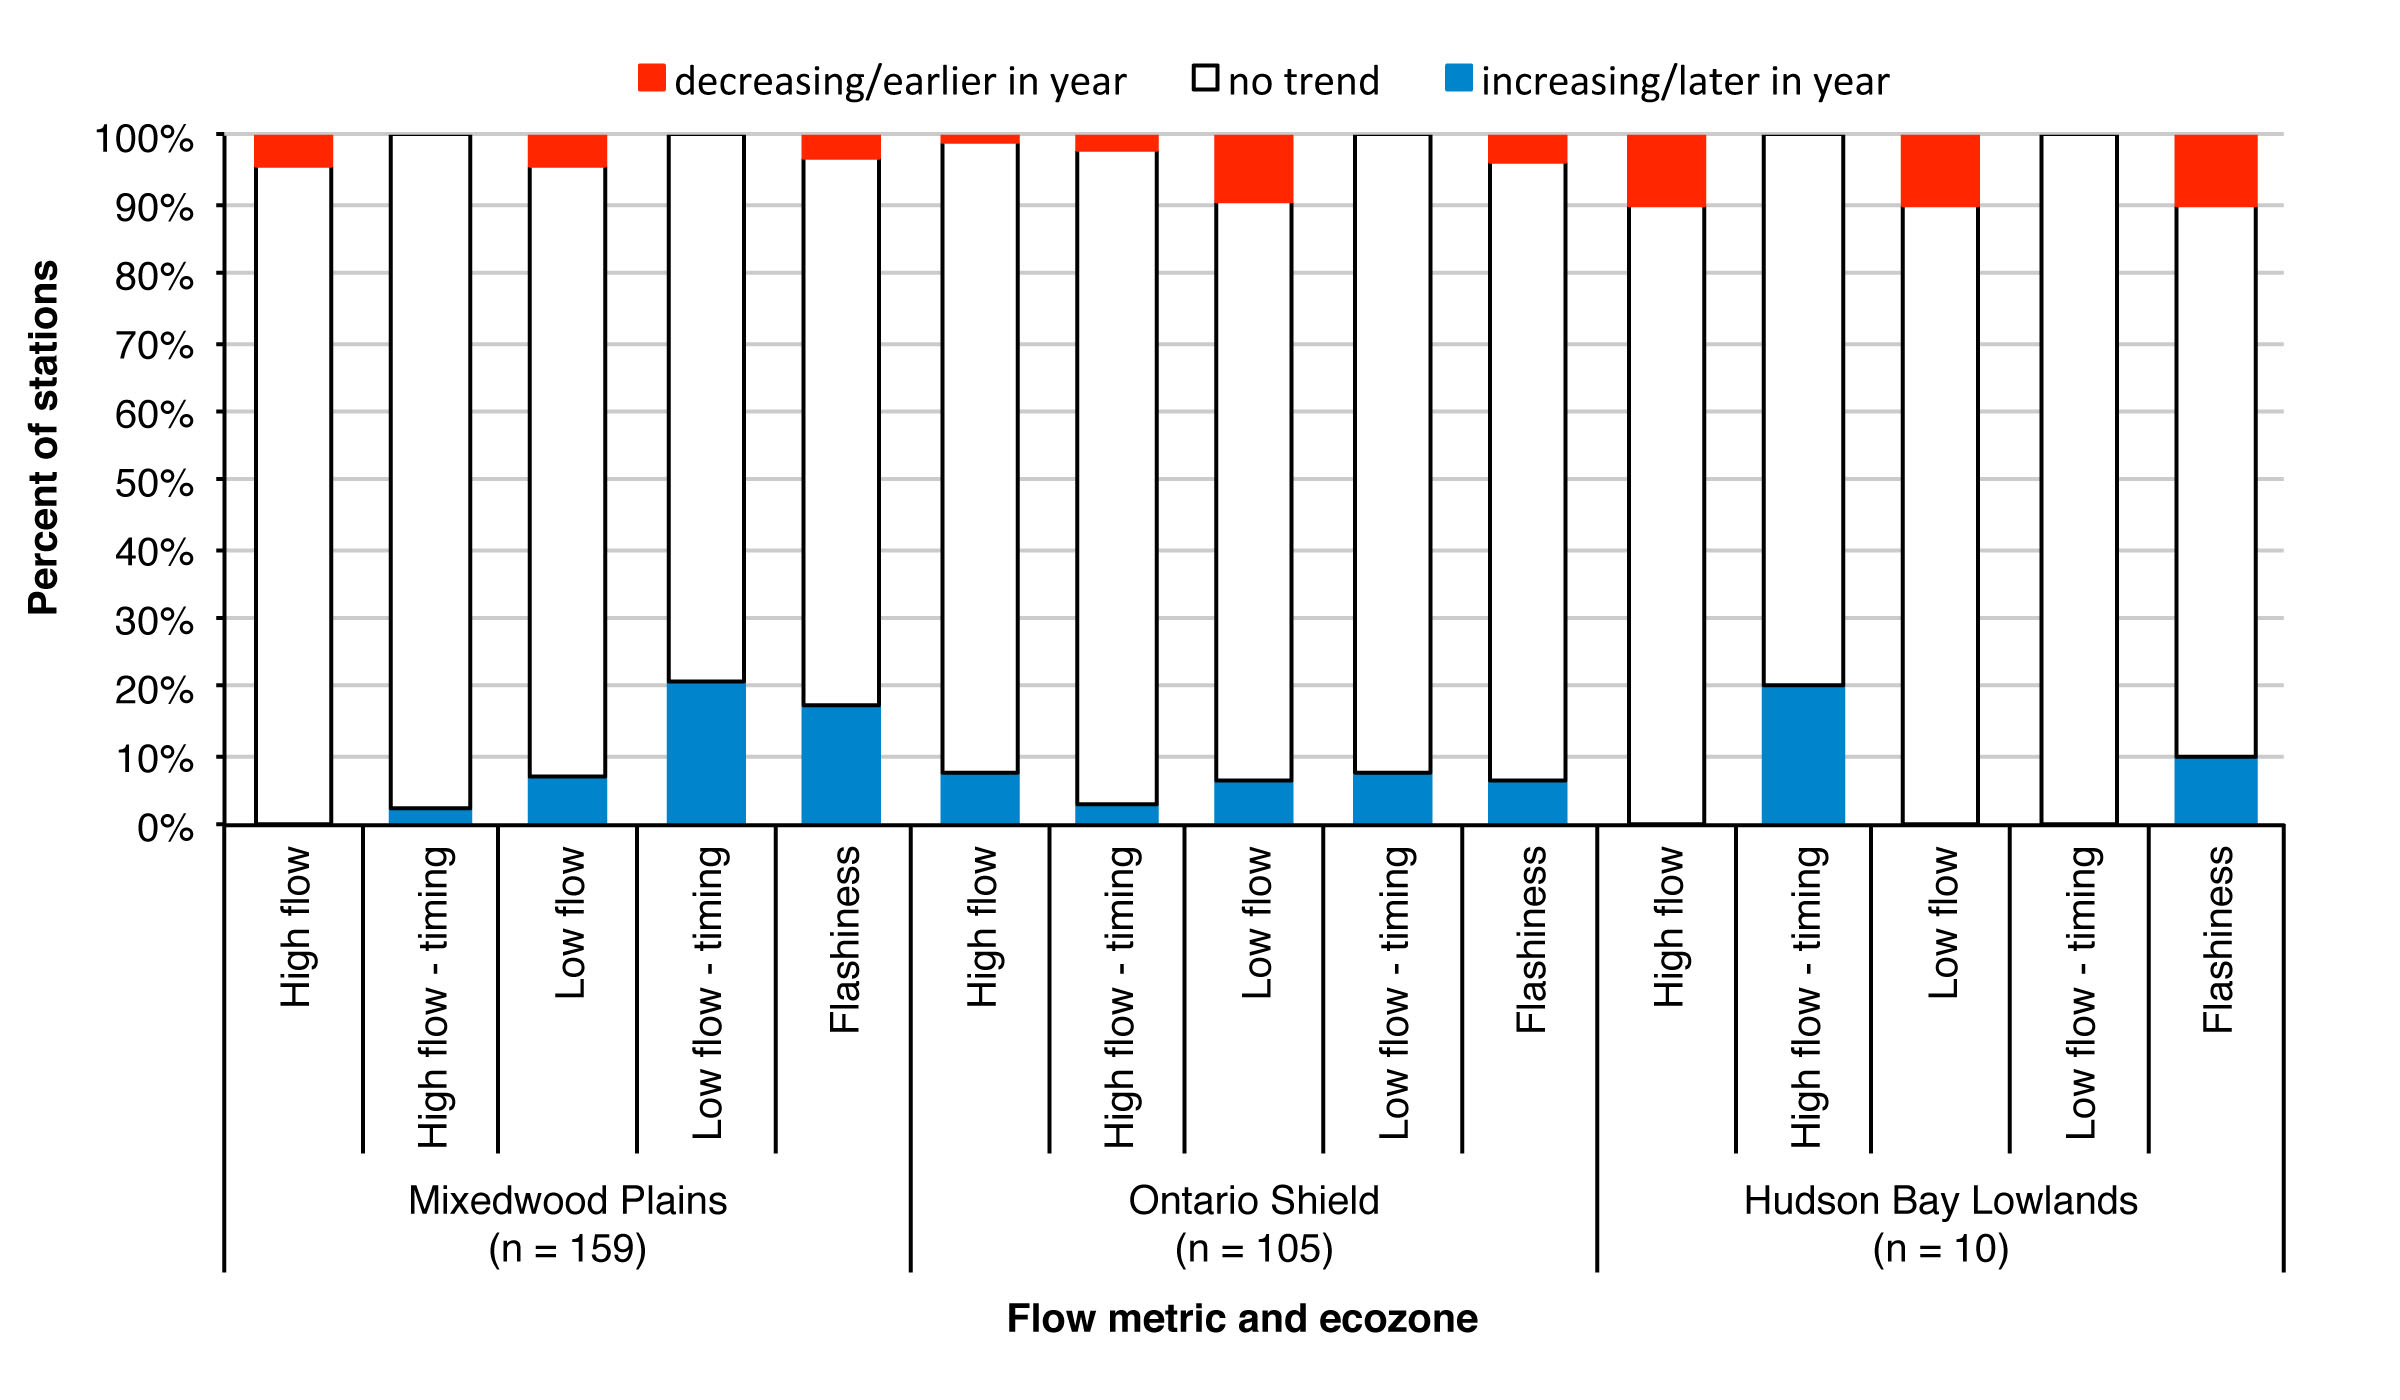
Figure 2. Summary of 1981-2010 trends in ecological flow metrics by ecozone.
Figure 2. Summary of 1981-2010 trends in ecological flow metrics by ecozone.
Status:
- Forty-two percent of stations (116 stations) had significant trends in at least one of the five ecological flow metrics over the 1981-2010 period. Nine percent (26 stations) had significant trends in multiple flow metrics. Among the 20 reference stations, only 30% showed significant trends and each station showed a trend in only one of the five flow metrics.
- Few stations showed trends in the amount of annual high flows (6%). Trends that were evident included decreasing high flows in some stations in the Mixedwood Plains Ecozone and increasing high flows in some stations in the northwestern portion of the Ontario Shield Ecozone.
- Only 4% of stations displayed trends in the timing of annual high flows and most tended toward later in the year. When examined over a longer period, 8% of 170 stations in the Mixedwood Plains Ecozone had trends of high flows earlier in the year consistent with predicted responses due to climate change.
- Thirteen percent of stations show trends in the amount of annual low flows, with both increases and decreases being equally represented.
- Fifteen percent of stations showed a trend towards a later date in minimum flows and all of these were in the Mixedwood Plains Ecozone and the southern part of the Ontario Shield.
- A higher proportion of stations showed significant trends for flashiness (17%) than for any other flow metric. Most of the stations with trends (78%) were increasing in flashiness and these stations were concentrated in the southwest portion of the Mixedwood Plains Ecozone.
Daily flow data were extracted from the Water Survey of Canada HYDAT (Water Survey of Canada 2014) database for 799 continuous stream flow monitoring stations in Ontario. Stations with current data and a continuous record of at least 30 years were included in long-term trend analysis. Stations with less than 90% of daily flow data for any month were excluded from the analysis. The resulting database includes 291 Ontario stations – 20 of these stations are considered as reference stations that have been relatively unimpacted by dams and other human influences on the landscape. Changes through time in annual stream flow metrics based on daily flow data were analyzed using the non-parametric Mann-Kendall rank regression (Helsell and Hirsch 2002, Helsell et al. 2006). Five flow metrics relevant to biodiversity (Table 1) were assessed for each individual station to determine significant long-term trends and their direction (i.e., increasing or decreasing for amount of flow and flashiness; earlier or later in year for high and low flows). Trends were analyzed for the period 1981-2010 (274 stations) as well as for the entire period of record (mean 53 years) for each station. Trends for the 1981-2010 period are presented below on maps at the provincial scale (Figure 1) and are summarized by ecozone (Figure 2). A more detailed account of the analysis and results can be found in a companion technical report (Jones et al. 2015).
It is important to note that trends in flow over a specific period of record will be influenced by climate trends (precipitation and temperature) warranting caution when interpreting trends. Longer term trends in flows for the stations included in this indicator are assessed and compared with trends over the most recent 30-year period in Jones et al. (2015).
Table 1. Description of flow metrics assessed for long-term trends.
| Flow characteristic |
Flow metric
|
Description |
| Amount |
3-day maximum |
Annual highest average flow over 3 consecutive days |
| 7-day minimum |
Annual lowest average flow over 7 consecutive days |
| Timing |
3-day maximum date |
Annual calendar day for 3-day maximum flow |
| 7-day minimum date |
Annual calendar day for 7-day minimum flow |
| Variability |
Richards-Baker Flashiness Index |
Annual index of changes in flows from one day to the next |
Related Target(s)
Web Links:
Water Survey of Canada – hydrometric data http://www.ec.gc.ca/rhc-wsc/default.asp?lang=En&n=894E91BE-1
Ontario Ministry of Natural Resources and Forestry – Surface Water Monitoring Centre http://www.ontario.ca/environment-and-energy/surface-water-monitoring-centre
References:
Bates, B.C., Z.W. Kundzewicz, S. Wu and J.P. Palutikof [editors]. 2008. Climate change and water. Technical Paper of the Intergovernmental Panel on Climate Change, IPCC Secretariat, Geneva, Switzerland.
Helsel, D.R., and R. M. Hirsch. 2002. Statistical methods in water resources techniques of water resources investigations, book 4, chapter A3. U.S. Geological Survey. [Available at: http://pubs.usgs.gov/twri/twri4a3/]
Helsel, D.R., Mueller, D.K., and Slack, J.R.. 2006. Computer program for the Kendall family of trend tests: U.S. Geological Survey Scientific Investigations Report 2005–5275. [Available at: http://pubs.usgs.gov/sir/2005/5275/]
Metcalfe, R.A., R.W. Mackereth, B. Grantham, N. Jones, R.S. Pyrce, T. Haxton, J.J. Luce, and R. Stainton.2013. Aquatic ecosystem assessments for rivers. Aquatic Research Series 2013-06. Science and Research Branch, Ministry of Natural Resources, Peterborough, ON.
Jones, N.E., A. Piggott, and A.J. Dextrase. 2014. Stream flow trends in Ontario – DRAFT. State of Ontario’s Biodiversity Technical Report Series, Report #SOBTR-07. Ontario Biodiversity Council, Peterborough, ON.
Poff, N.L., J.D. Allan, M.B. Bain, J.R. Karr, K.L. Prestegaard, B.D. Richter, R.E. Sparks, and J.C. Stromberg. 1997. The natural flow regime. Bioscience 47:769-784.
Poff, N.L., B.P. Bledsoe, and C.O. Cuhaciyan. 2006. Hydrologic variation with land use across the contiguous United States: geomorphic and ecological consequences for stream ecosystems. Geomorphology 79:264–285.
Richter, B.D., J.V. Baumgartner, J. Powell, and D.P. Braun. 1996. A method for assessing hydrologic alteration within ecosystems. Conservation Biology 10:1163-1174.
Water Survey of Canada. 2014. Hydrology of Canada. [Available at: http://www.ec.gc.ca/rhc-wsc/default.asp?lang=En&n=E94719C8-1, accessed 15 January, 2014].


