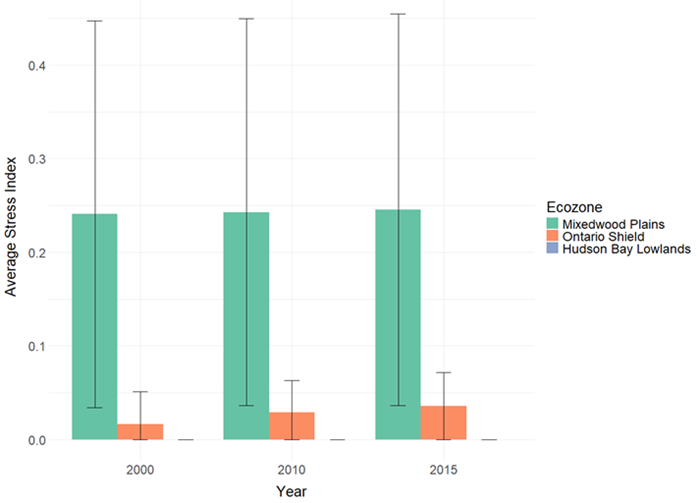
Figure 1. The average Aquatic Stress Index within broad-scale monitoring (BsM) lake watersheds summarized across the three Ecozones in Ontario (Hudson Bay Lowlands, Ontario Shield, and Mixedwood Plains) for the years 2000, 2010, and 2015. M Bars represent one standard deviation.
A)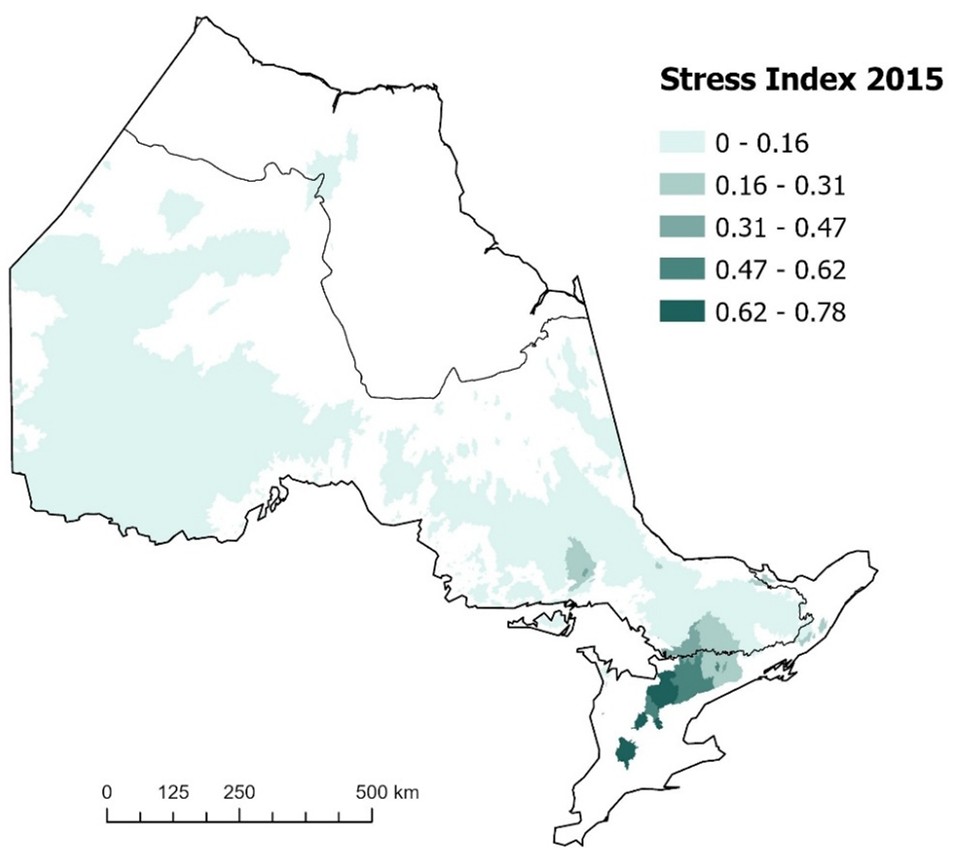 B)
B)
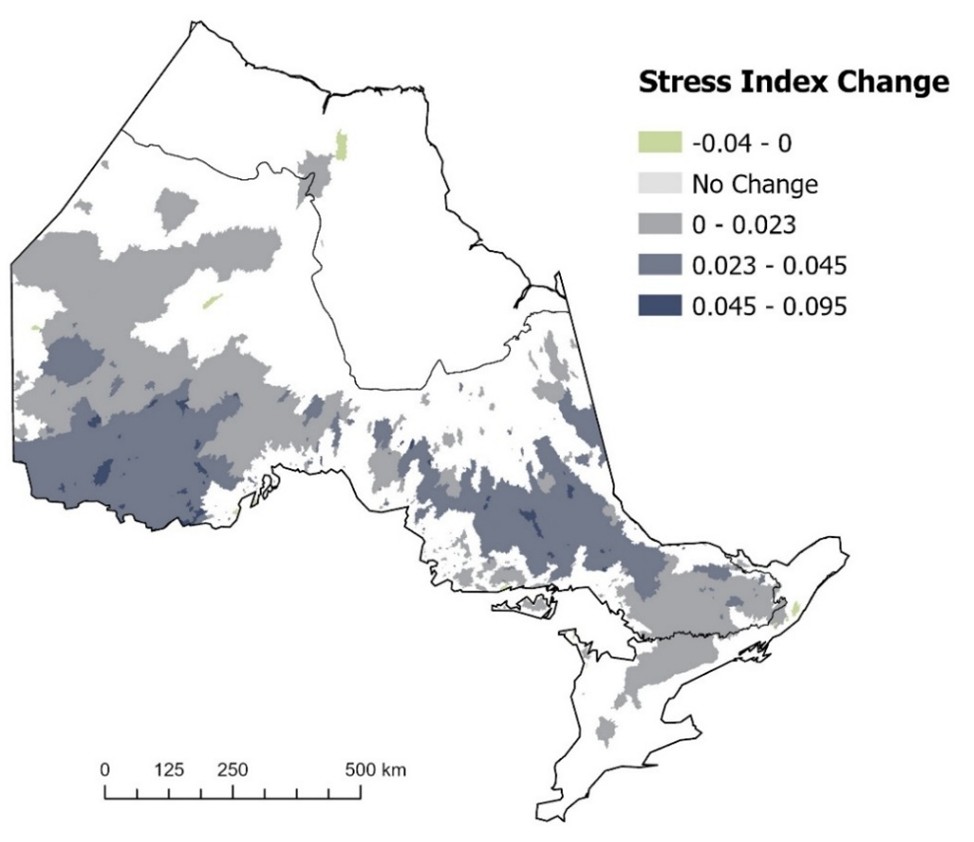
Figure 2. The average Aquatic Stress Index across broad-scale monitoring (BsM) lake watersheds in Ontario for A) the year 2015 and B) changes in index scores between 2000 and 2015 (negative values indicate reduced stress and positive values indicate increased stress). Solid black lines indicate ecozone boundaries (from south to north: Mixedwood Plains, Ontario Shield, and Hudson Bay Lowlands).
Status:
- Overall, the broad-scale monitoring watersheds in Ontario have increased in human modification by an average of 0.028 in 2000 to 0.046 in 2015, an increase of 64.3%.
- Broad-scale monitoring watersheds in the Mixedwood Plains Ecozone (n = 63 watersheds) have the highest levels of average human modification ranging from 0.241 in 2000 to 0.245 in 2015, which represents a 1.7% increase. The Stress Index increased in 52 watersheds (82.5%) and decreased in 11 watersheds (17.5%) in this ecozone.
- The average Stress Index increased the most in broad-scale monitoring watersheds within the Ontario Shield Ecozone (n = 1159 watersheds) from 0.016 to 0.036 between 2000 and 2015, which represents a 125% increase. The Stress Index increased for 1137 watersheds (98.1%) and decreased for 22 watersheds (1.9%). Fisheries management zones which have had relatively large increases in human modification include zones 5 (Fort Frances, Kenora, Dryden) and 6 (Thunder Bay, Nipigon, Dryden) in the northwest and zone 8 (Hearst, Chapleau, Cochrane, Timmins, Kirkland Lake) in the northeast.
- Hudson Bay Lowlands have experienced comparatively low human modification with index values less than 0.0001 in both 2000 and 2015. However, it should be noted that there have been very few broad-scale monitoring monitored lakes in this ecozone (n = 5).
- The Stress Index within broad-scale monitoring watersheds in the Mixedwood Plains Ecozone was almost seven times higher than watersheds in the Ontario Shield in 2015.
Aquatic Stress Index values represent the average degree of human modification within each watershed (Theobald et al. 2000). Human modification values are based on the following stressor types: urban and built-up areas, crop and pasture lands, livestock grazing, mining and quarrying, power generation (renewable and non-renewable), roads, railways, logging and wood harvesting, human intrusion, reservoirs, and air pollution. For each stressor type, human modification is calculated using the proportion of an area that is impacted by that stressor, the probability of stressor occurrence, and stressor intensity. Human modification scores for each stressor type are then combined additively to produce an overall score.
Human modification values were gathered for the years 2000, 2010, and 2015. The Zonal Statistics tool in ArcGIS was used to calculate a mean value of human modification for the upstream catchment of each lake monitored by the broad-scale monitoring program in Ontario. Broad-scale monitoring watersheds were selected as they represent the majority of larger Ontario lakes that support substantial recreational fishing resources in Ontario. Notably, human modification closer to a lake is more likely to have an influence on the lake habitat quality, and future iterations of the Aquatic Stress Index may benefit from including a proximity factor in its analysis. The spatial resolution of this dataset was 300m (0.09km2) and it was indexed on a 0-1 scale, where a value of 1 represents areas experiencing the highest level of stress, and 0 denotes areas with no observed stress.
Ecozone data were paired with the broad-scale monitoring watershed delineations using the Pairwise Intersect tool in ArcGIS Pro. In the event the watersheds overlapped multiple ecozones, the watershed was assigned the dominant ecozone by area of overlap.
Related Target(s)
Web Links:
Ecozones:https://geohub.lio.gov.on.ca/datasets/13a94ec0c0dd42d499184c3bb92edf25_17/explore?location=49.874140%2C-84.745000%2C3.92
Great Lakes Environmental Assessment and Mapping Project Phase II – https://graham.umich.edu/activity/16536
Great Lakes Aquatic Habitat Framework – https://hub.glahf.org/
References:
Albert, J.S., G. Destouni, S.M. Duke-Sylvester, A.E. Magurran, T. Oberdorff, R.E. Reiss, K.O. Winemiller, and W.J. Ripple. 2021. Scientists’ warning to humanity on the freshwater biodiversity crisis. Ambio 50:85-94.
Chu, C., C.K. Minns, N.P. Lester, and N.E. Mandrak. 2015. An updated assessment of human activities, the environment, and freshwater fish biodiversity in Canada. Canadian Journal of Fisheries and Aquatic Sciences 72:135-148.
Dudgeon, D., A.H. Arthington, M.O. Gessner, Z.I. Kawabata, D.J. Knowler, C. Lévêque, R.J. Naiman, A.H. Prieur-Richard, D. Soto, M.L.J. Stiassny, and C.A. Sullivan. 2006. Freshwater biodiversity: importance, threats, status and conservation challenges. Biological Reviews of the Cambridge Philosophical Society 81: 163-182.
Helfman, G.S. 2007. Fish conservation: a guide to understanding and restoring global aquatic biodiversity and fishery resources. Island Press, Washington, D.C.
Theobald, D.M., C. Kennedy, B. Chen, J. Oakleaf, S. Baruch-Mordo, and J. Kiesecker. 2020. Earth transformed: detailed mapping of global human modification from 1990 to 2017. Earth System Science Data 12:1953–1972.
WWF. 2024. Living Planet Report 2024 – A System in Peril. WWF, Gland, Switzerland.
Ontario’s 36 Conservation Authorities (CAs) are local management agencies that deliver services and programs to protect and manage water and other natural resources on a watershed basis. CAs work in partnership with all levels of government, landowners and other organizations. They promote an integrated approach and aim to balance human, environmental and economic needs. Strong and resilient natural ecosystems help humans adapt to many different challenges, including the impacts of climate cha…
Read More
