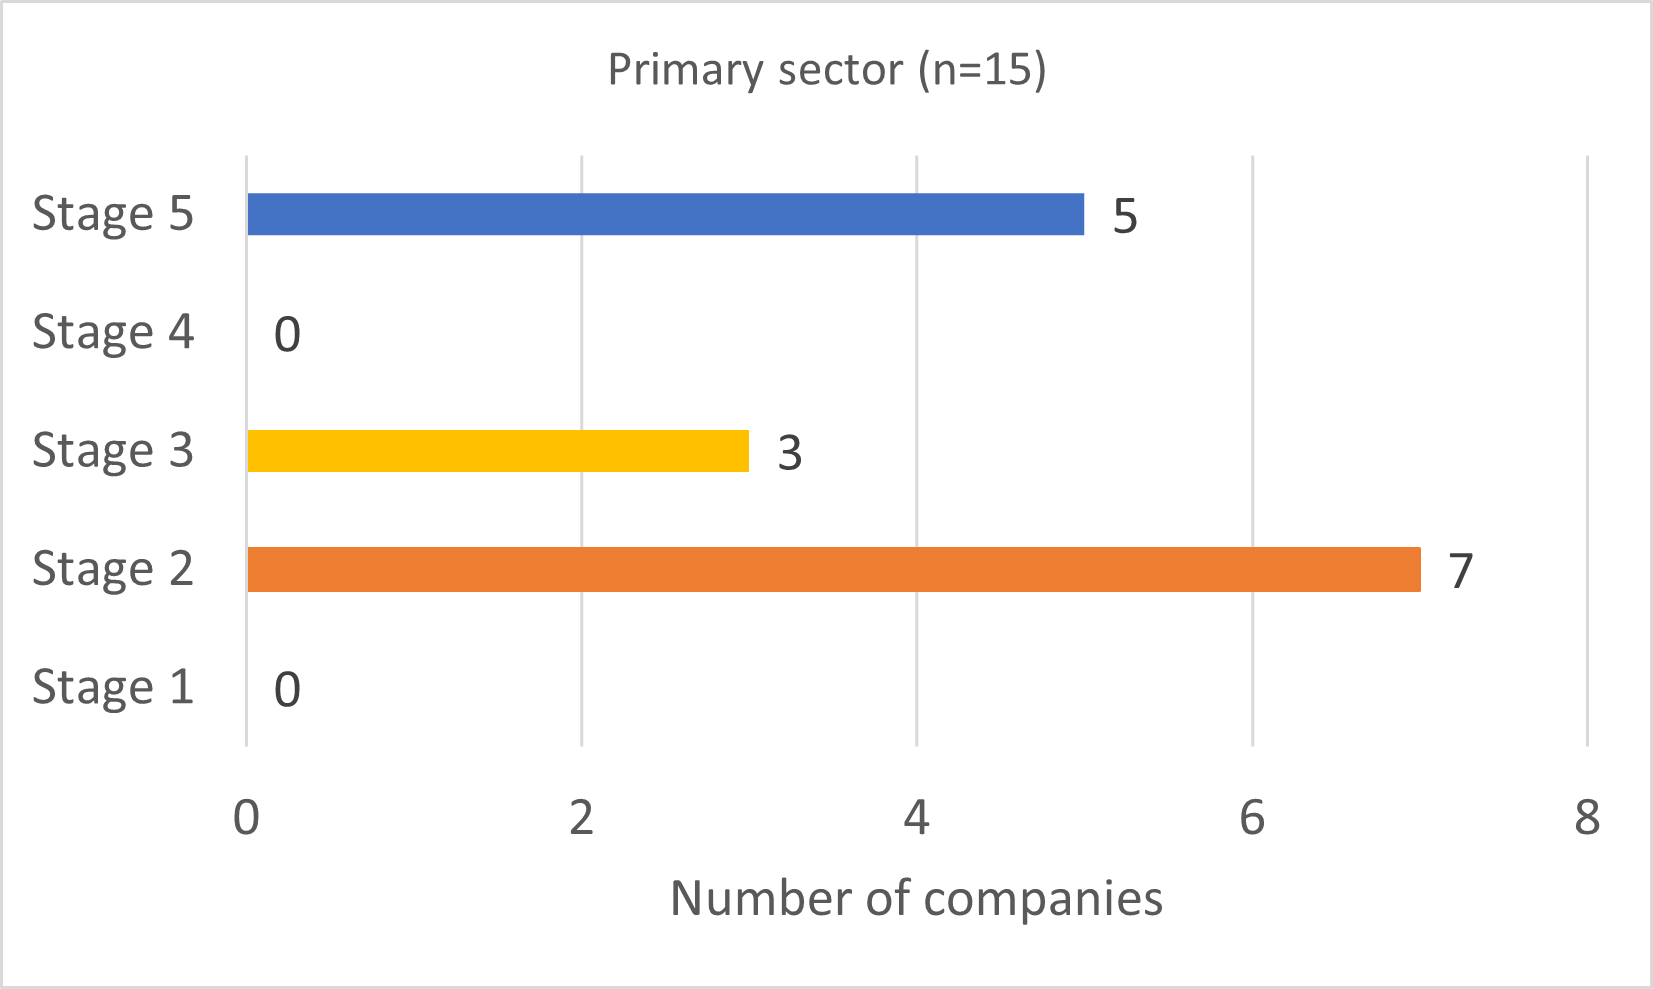
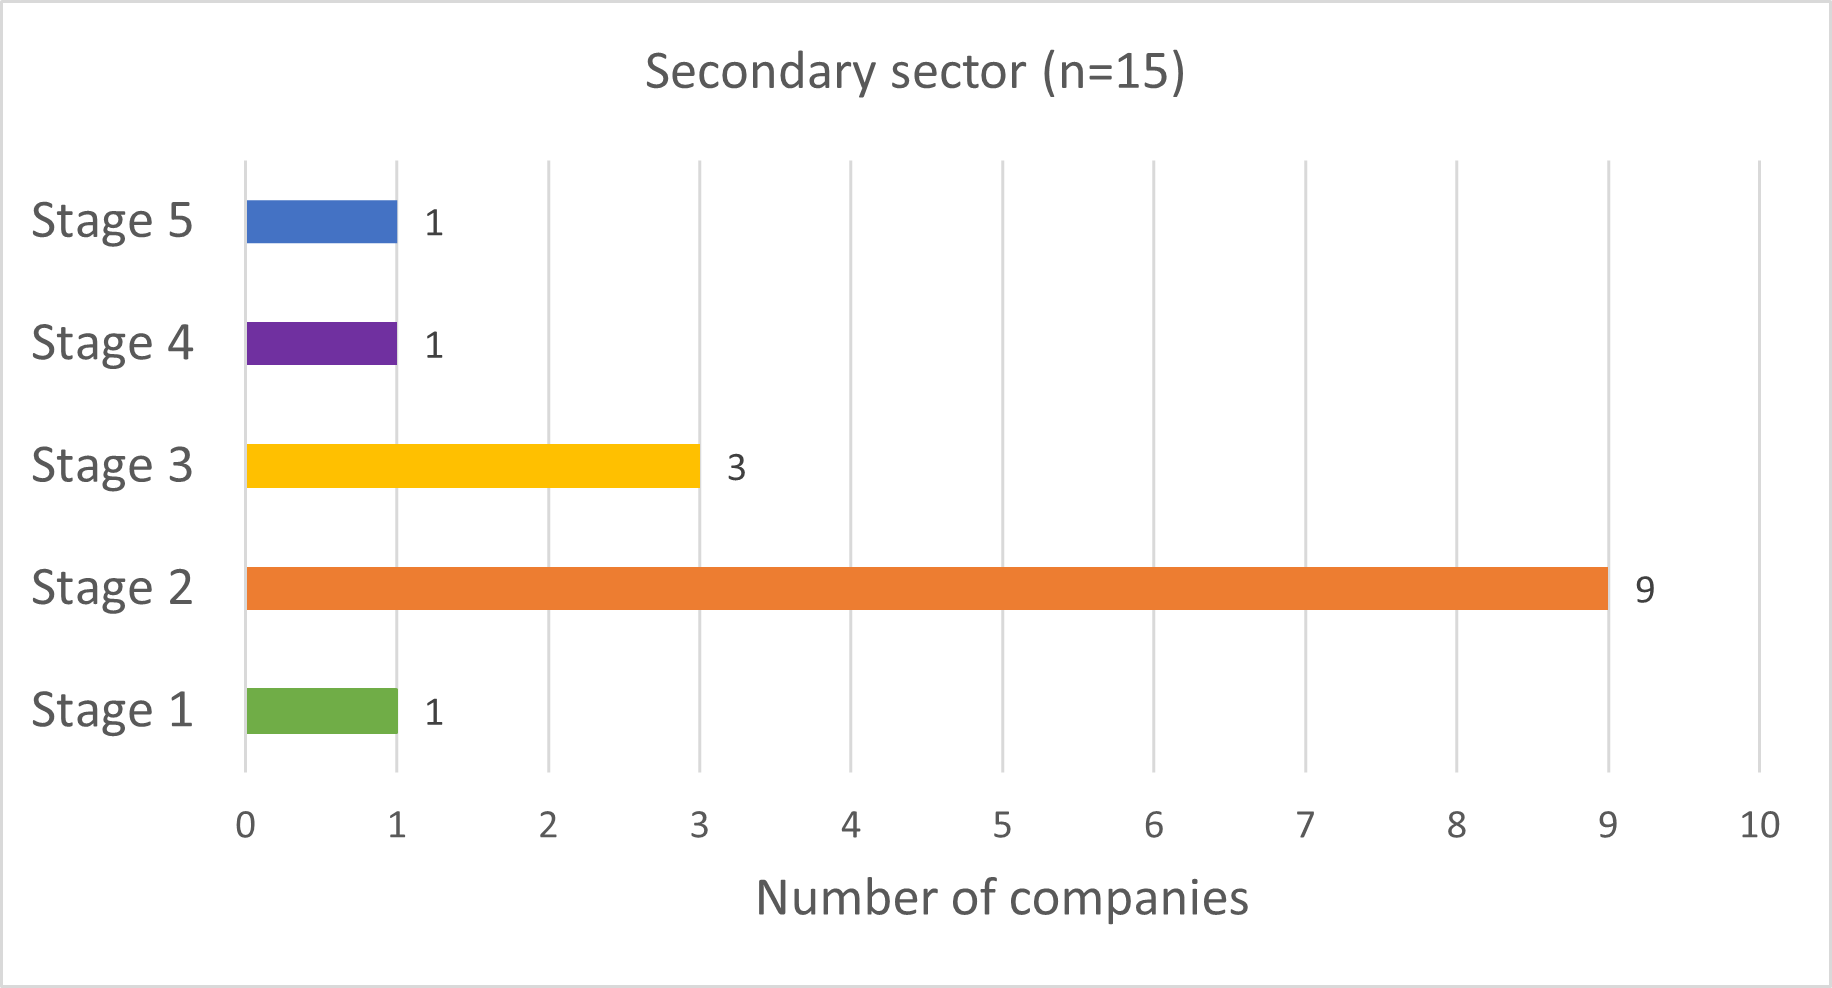
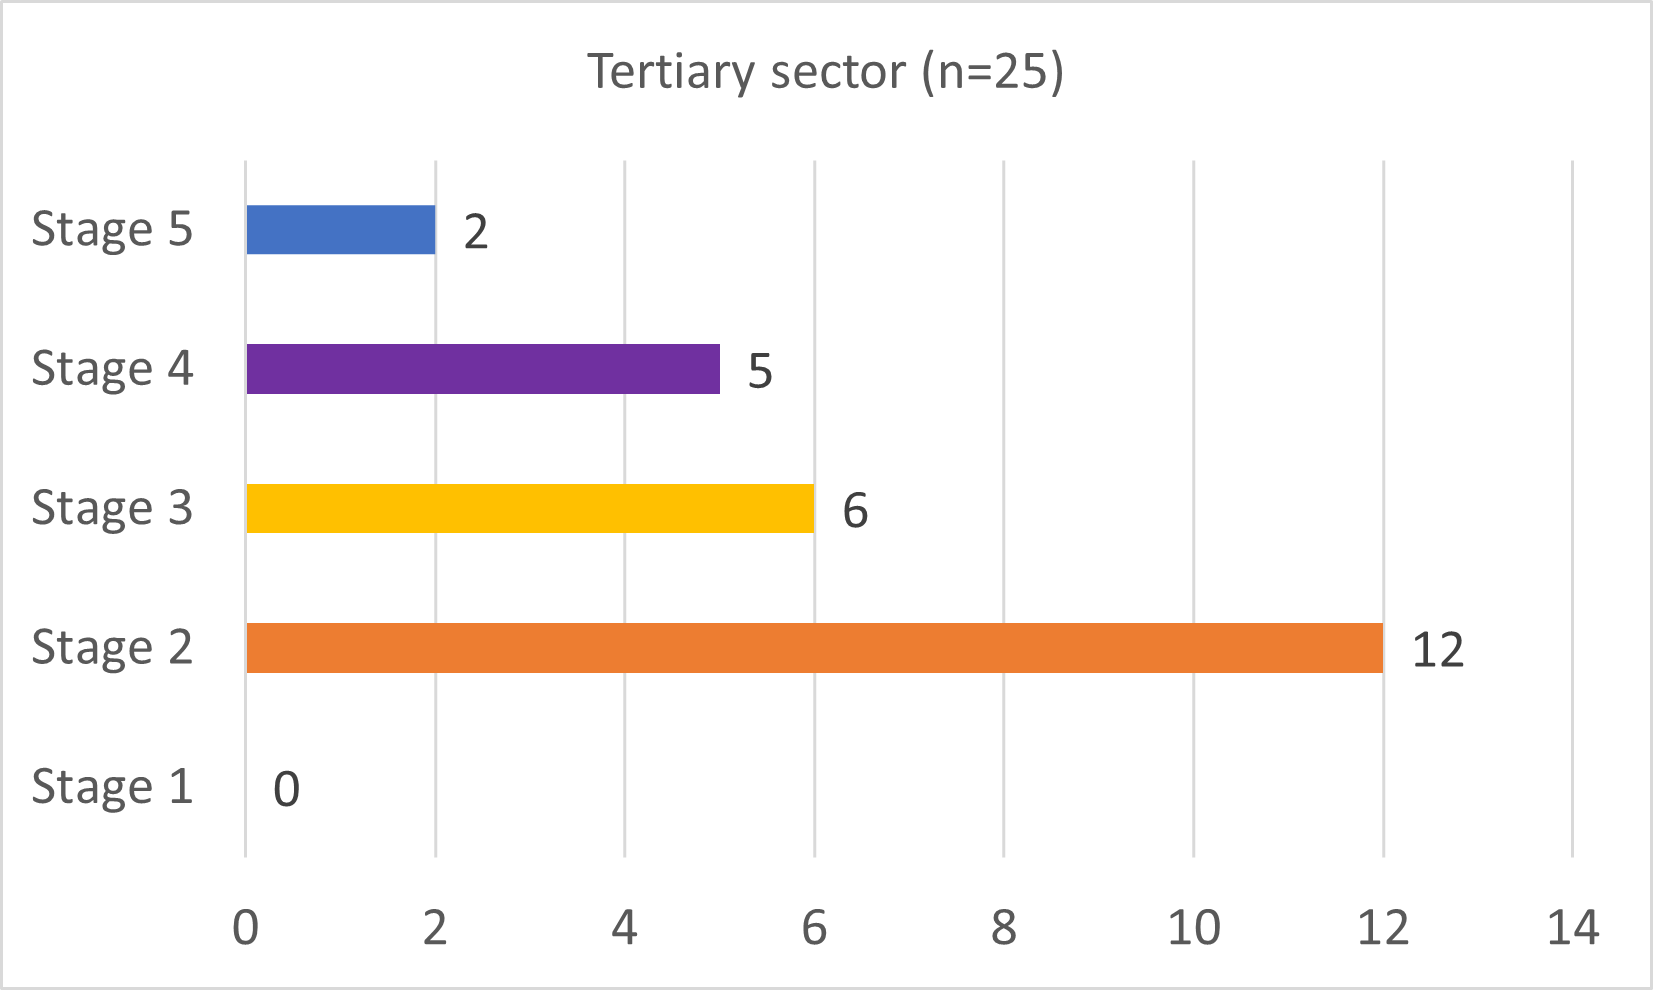
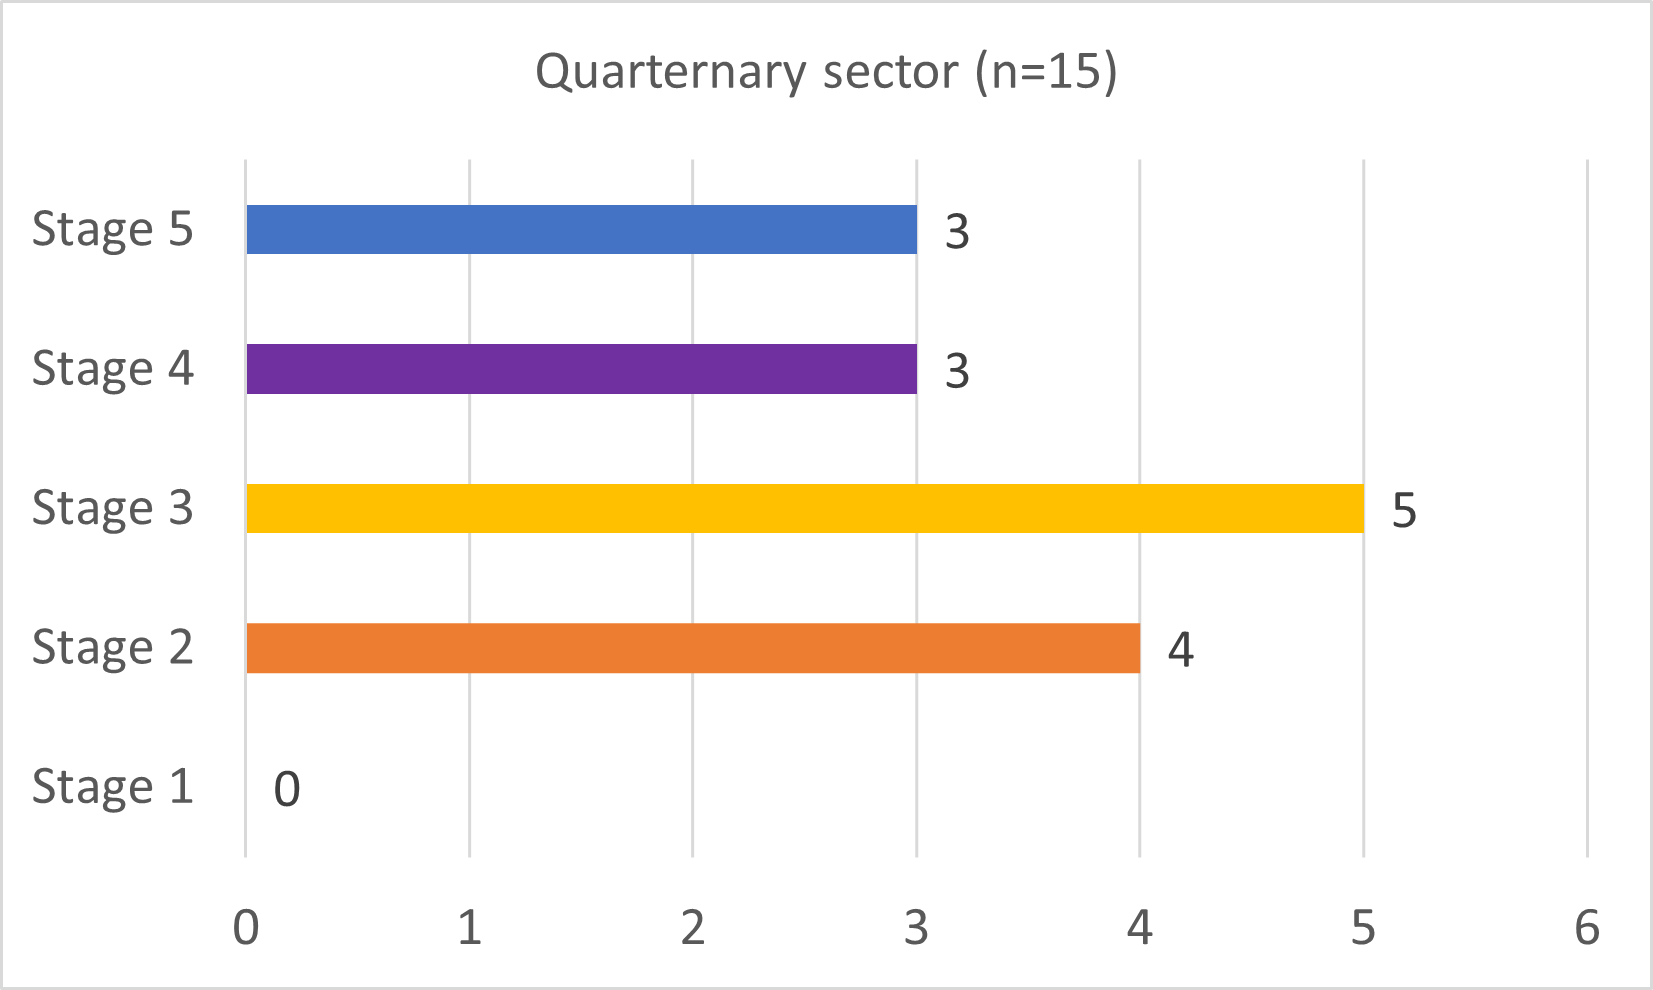
Seventy (70) Ontario companies were reviewed to examine which ones have integrated biodiversity in their corporate planning and reporting. Most companies within the primary, secondary and tertiary sectors did report on environmental issues (Figure 2). Each sector had a portion that did have a biodiversity monitoring system, with the largest of those being within the primary sector (33%).
- Stage 1: No consideration of environmental issues
- Stage 2: Report on environmental issues
- Stage 3: Report on biodiversity, including impacts
- Stage 4: Consider biodiversity conservation as a key strategic issue (plans and policies)
- Stage 5: Have a biodiversity monitoring system
Figure 2. Summary of biodiversity consideration of different sectors operating in Ontario in 2014 and 2019 (n = 70).
Overall, across all sectors, the majority of companies (32) fell into stage 2 – Report on environmental issues, followed by 17 companies in stage 3 – report on biodiversity, including impacts. Eleven companies had a biodiversity monitoring system (Figure 3).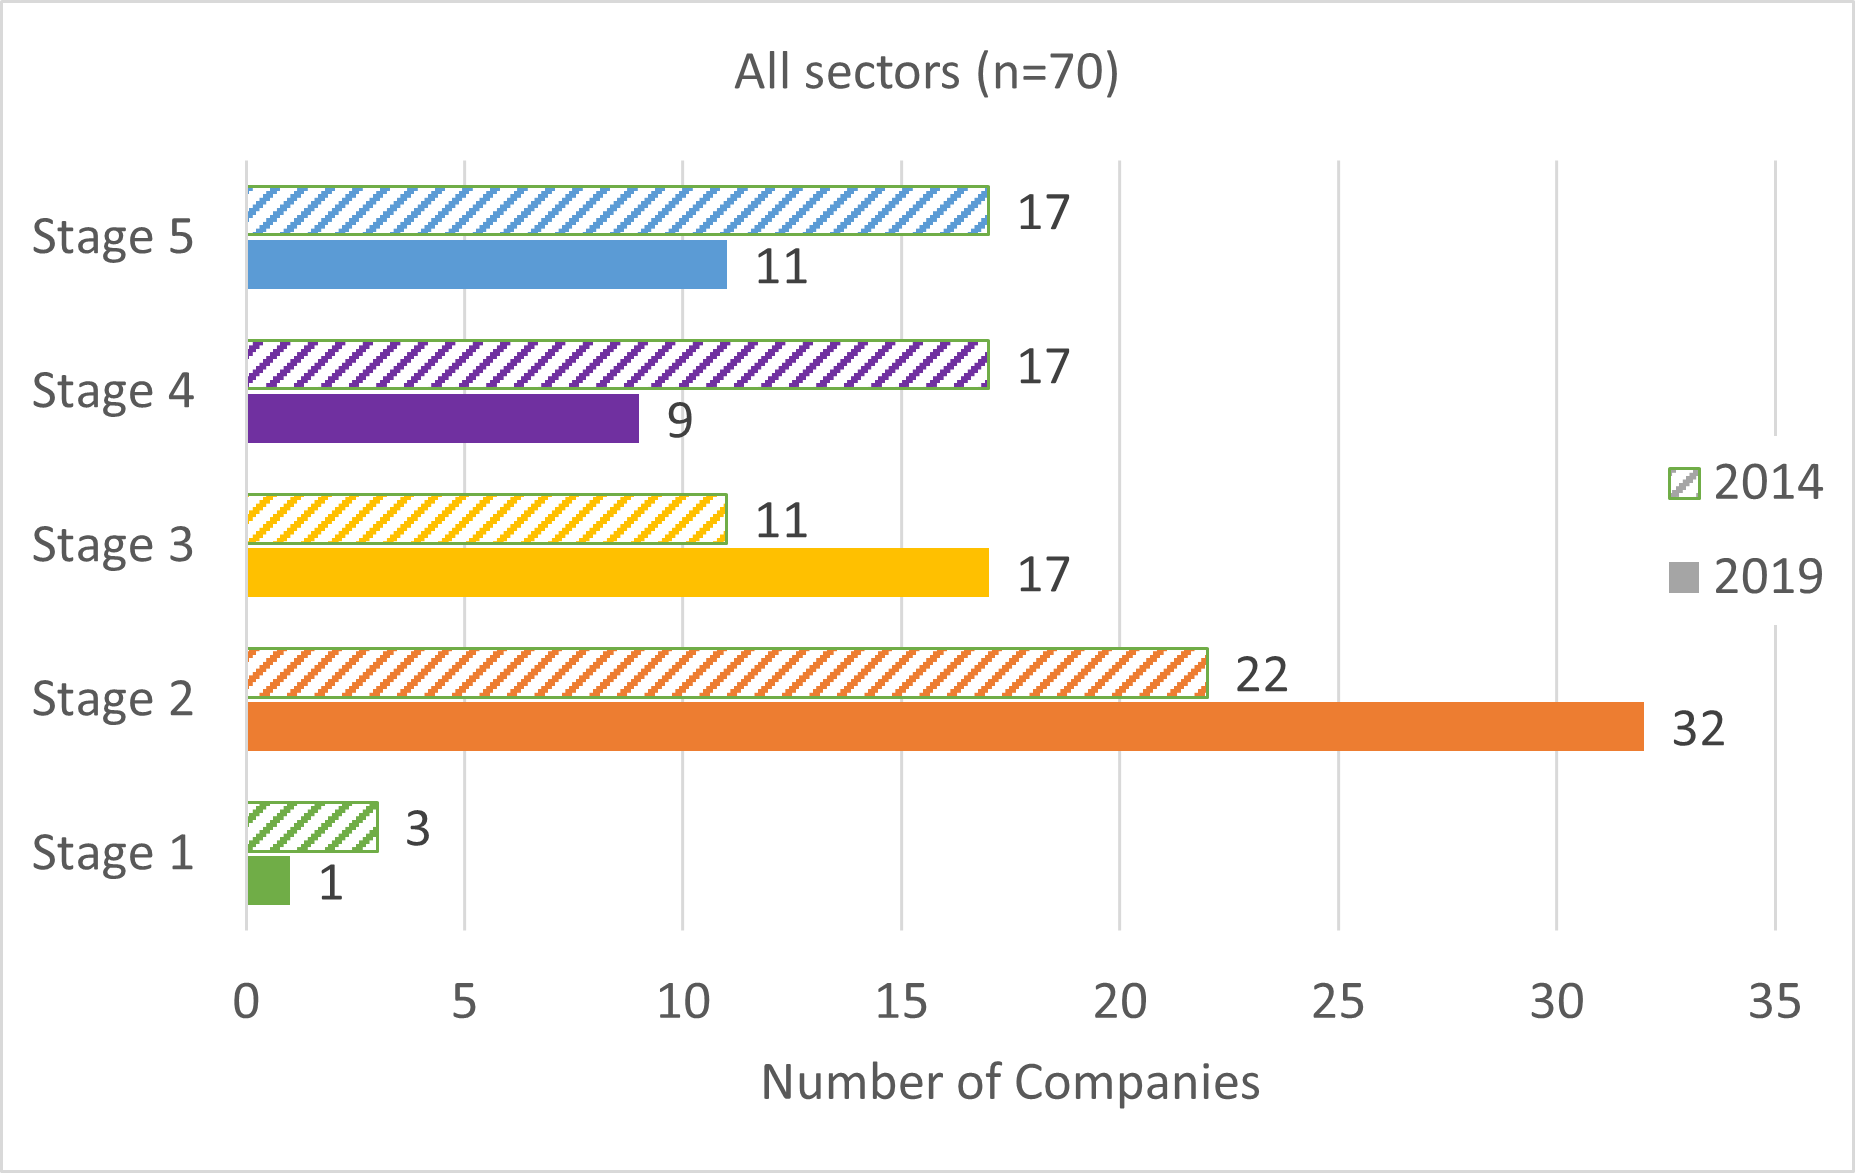
- Stage 1: No consideration of environmental issues
- Stage 2: Report on environmental issues
- Stage 3: Report on biodiversity, including impacts
- Stage 4: Consider biodiversity conservation as a key strategic issue (plans and policies)
- Stage 5: Have a biodiversity monitoring system
Figure 3. Summary of biodiversity consideration by all sectors operating in Ontario in 2014 and 2019 (n = 70).
Status:
- The primary sector had 5 companies in stage 5, recording the largest number of companies with developed biodiversity monitoring systems, this is down from 9 companies of that sector in 2015. The quaternary sector had the next highest with 3 companies (1 in 2014), followed by the tertiary with 2 companies (1 in 2015) and the secondary had 1 company (down from 6 in 2015).
- In 2019, only one company in this study did not consider biodiversity or environmental issues in their corporate programs and policy, this is compared to 3 companies in the last SOBR update.
- The majority of companies in this study, (32), fell into the stage 2 category which is described as a report on environmental issues and/or sustainable development, but did not explicitly consider biodiversity. This is up from 22 companies in 2014.
- Stage 3 are companies that report on biodiversity, including acknowledgement of their negative impacts, 17 companies were in this category in 2019. This was an increase from 2014 at 11 companies.
- Companies that considered biodiversity a key strategic issue and had developed plans and policies decreased to 9 companies, compared to 11 in 2015.
- Stage 5 saw a decrease as well — 11 companies had developed biodiversity monitoring systems, compared to 17 of the companies in 2015.
For a list of companies that were assessed in 2015 see full report here. See full list of 2019 companies here.
Previously assessed in the SOBR 2015 report, the same methods were used in this update. A list of the top 70 revenue earning businesses in Ontario in 2019 was reviewed and assessed to determine which have integrated biodiversity in their corporate planning and reporting. Businesses were categorized into four main sectors: primary, secondary, tertiary and quaternary (Table 1) (Mayda 2012).
Table 1. Industries used to study biodiversity integration into all sectors of business in Ontario.
Primary (n=15)
|
Secondary (n=15)
|
Tertiary (n=25) |
Quaternary (n=15)
|
- Agriculture and forestry
- Gas and oil
- Mining and Quarrying
|
- Construction
- Manufacturing
- Utilities
|
- Entertainment
- Finance
- Food Services
- Real estate
- Retail & wholesale
- Transportation
|
- Communication
- Government funded recipients
- Technology
|
The four sectors were further categorized into industries identified in Statistics Canada’s North American Industry Classification System (NAICS 2012) to produce a sector categorization (Table 2).
Within each industry, the five most profitable publicly traded and private companies in Canada, as identified by the Globe and Mail’s Top 1000 Business Report, were included in the analysis. The selected companies either had headquarters, operations, and/or sold products in Ontario, considering the interconnectedness and complexity of business supply chains. We examined each company’s publicly available annual corporate social responsibility and sustainability reports, as well as their websites, using keyword searches for terms such as biodiversity, biological diversity, ecosystem, nature, and sustainability.
The framework used to evaluate these companies was based on criteria developed for studying the integration of biodiversity into the business sector, as outlined in the previous SOBR indicator Biodiversity in Ontario’s business sector (2015) [link to be included]. This evaluative model drew on several studies including: The Economics of Ecosystems and Biodiversity in Business and Enterprise (TEEB 2012), The Ecosystem Services Benchmark: A guidance document (Grigg et al. 2009), Tread lightly: Biodiversity and ecosystem services risk and opportunity management within the extractive industry (Grigg et al. 2011), and Linking shareholder and natural value: Managing biodiversity and ecosystem services risk in companies with an agricultural supply chain (Grigg et al. 2009).
In this analysis, the degree to which the company is concerned with biodiversity was categorized into one of five successive categories (Table 2). Further details related to the analysis can be found in the 2014 companion technical report (Potter et al. 2014).
Table 2: Stages of biodiversity concern for companies. See Potter et al. 2014 for list of criteria.
| Category |
Companies that:
|
| 1 |
Have no consideration of biodiversity or sustainable development/environmental issues |
| 2 |
Report on sustainable development/environmental issues |
| 3 |
Report on biodiversity, including acknowledgement of impacts |
| 4 |
Consider biodiversity conservation a key strategic issue and have plans/policies to address it |
| 5 |
Have developed and implemented a biodiversity monitoring system and/report on results of the monitoring |
Related Theme(s)
Web Links:
Biodiversity: It’s in our Nature – Ontario Government Plan to Conserve Biodiversity 2012-2020 http://viewer.zmags.com/publication/c8f28fef
Canadian Business and Biodiversity Council http://www.businessbiodiversity.ca/
CPA Ontario; Why sustainability is good business https://assets.cpaontario.ca/sustainability/pdfs/why_sustainability_is_good_business.pdf
Fauna and Flora International http://www.fauna-flora.org/
Forest Footprint Disclosure Project www.forestdisclosure.com
Global Reporting Initiative www.globalreporting.org
Halton Region – A Biodiversity Strategy for the Halton Regional Forests http://www.halton.ca/cms/One.aspx?portalId=8310&pageId=9819
ICMM Good Practice Guidance for Mining and Biodiversity www.icmm.com
Integrated Biodiversity Tool www.ibatforbusiness.org/
IPIECA/API Oil and Gas Industry Guidance on Voluntary Sustainability Reporting www.ipieca.org
Ontario Power Generation – Biodiversity http://www.opg.com/about/environment/Pages/environment.aspx
The Ontario Biodiversity Council www.ontariobiodiversitycouncil.ca
The Keystone Centre www.keystone.org
The Stewardship Network of Ontario Stewardship Strategy 2013 http://stewardshipnetwork.ca/files/2012/03/SNO-Stewardship-Strategy-May-2013.pdf
Natural Value Initiative http://www.naturalvalueinitiative.org/
Roundtable on Sustainable Biomaterials www.rsb.org
Roundtable on Sustainable Palm Oil www.rspo.org
Royal Ontario Museum http://www.rom.on.ca/nature
Stewardship Index for Specialty Crops www.stewardshipindex.org
The Economics of Ecosystems and Biodiversity Initiative http://www.teebweb.org/
Water Footprint Network www.waterfootprint.org
WBCSD Cement Sustainability Initiative www.wbcsdcement.org
References:
Grigg, A., M. Harper, and S. Verbunt. 2011. Tread lightly: biodiversity and ecosystem services risk and opportunity management within the extractive industry. The Natural Value Initiative. [Available at: http://www.naturalvalueinitiative.org/download/documents/Publications/NVI%20Extractive%20Report%20Executive%20Summary.pdf ]
Grigg, A., Z. Cullen, J. Foxall, L. Crosbie, L. Jamison, and R. Brito. 2009. The ecosystem services benchmark. Fauna & Flora International, United Nations Environmental Programme Finance Initiative and Fundacao Getulio Vargas – FGV. [Available at: http://www.naturalvalueinitiative.org/download/documents /Publications/EcoSysBenchmark.pdf]
Grigg, A., Z. Cullen, J. Foxall, and R. Strumpf. 2009. Linking shareholder and natural value. Managing biodiversity and ecosystem services risk in companies with an agricultural supply chain. Fauna and Flora International, United Nations Environmental Programme Finance Initiative and Fundacao Getulio Vargas – FGV. [Available at: http://www.naturalvalueinitiative.org/download/documents/Publications/LSNV_ Oct09.pdf]
Ontario Biodiversity Council. 2011. Ontario’s biodiversity strategy, 2011: renewing our commitment to protecting what sustains us. Ontario Biodiversity Council, Peterborough, ON.
Ontario’s Biodiversity Council. 2023.Ontario’s Biodiversity Strategy 2023-2030: Summary. Ontario Biodiversity Council, Peterborough, ON.
Ontario’s Biodiversity Strategy (OBS). 2005. Ontario’s biodiversity strategy, 2005: protecting what sustains us. Queen’s Printer for Ontario, Peterborough, ON [Available at: http://snobeanobc.com/OBC2015/wp-content/uploads/2012/03/OBS_2005.pdf].
Ontario Biodiversity Council. 2020. State of Ontario’s Biodiversity. Ontario Biodiversity Council, Peterborough, Ontario. [Available at: https://sobr.ca/wp-content/uploads/state-of-biodiversity-report-E-FINAL-aoda-with-links-and-correction-1.pdf]
Mayda, C. 2013. A regional geography of the United States and Canada: toward a sustainable future. Rowman & Littlefield Publishers, Lanham, MD.
Potter, K., A. Zohar and T. McIntosh. 2014. An evaluation of the integration of biodiversity into business in Ontario. State of Ontario’s Biodiversity Technical Report Series, Report #SOBTR-02.
Statistics Canada. 2012. North American Industry Classification System (NAICS) Canada. [Available at: http://www.statcan.gc.ca/pub/12-501-x/12-501-x2012001-eng.pdf]
The Economics of Ecosystems and Biodiversity (TEEB). 2012. The economics of ecosystems and biodiversity in business and enterprise. Edited by Joshua Bishop. Earthscan, London and New York. [Available at: http://www.teebweb.org/publication/the-economics-of-ecosystems-and-biodiversity-teeb-in-business-and-enterprise/]
The Economics of Ecosystems and Biodiversity (TEEB). 2010. The economics of ecosystems and biodiversity report for business – executive summary [Available at: http://www.teebweb.org/media/2012/01/TEEB-For-Business.pdf].
The Globe and Mail. (25 June 2014). Canada’s top companies by industry. [Available at: http://www.theglobeandmail.com/report-on-business/rob-magazine/top-1000/rankings/canadas-top-companies-by-industry/article19344470/]
The Globe and Mail. (27 June 2013). Top 1000: Exclusive rankings of Canada’s most profitable companies. [Available at: http://www.theglobeandmail.com/report-on-business/rob-magazine/top-1000/top-1000/article12829649/#dashboard/follows/]
The Globe and Mail. (26 April 2019). Top 1000: Report on Business magazine’s exclusive ranking of Canada’s largest companies. [available at: The Top 1000: Our annual ranking of Canada’s largest companies – The Globe and Mail]
At first glance, a sand or gravel pit may not seem a likely place to find innovation in biodiversity. But look beyond the piles of sand and stone, and you’ll soon discover the enormous care Ontario’s aggregate producers take to ensure biodiversity. Rehabilitated pit As stewards of Ontario’s aggregate resources (stone, sand and gravel), aggregate producers work hard to be good neighbours and land stewards by implementi…
Read More
