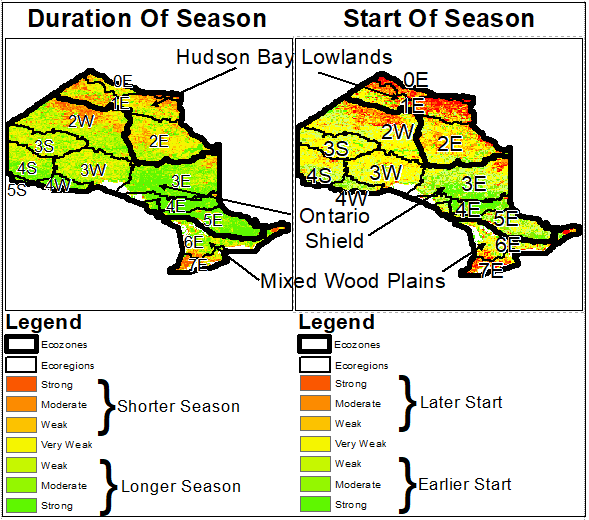
Figure 1. Map showing ecozones (thick black outlines), ecoregions (thin black outlines) and statistically significant weak, moderate and strong correlations between advancing years (1982 to 2019) and duration and start of growing seasons. Areas of earlier and longer growing seasons shown in shades of green, and areas of shorter and later growing seasons shown in shades of red/orange. Very weak/non-significant trends shown in yellow.
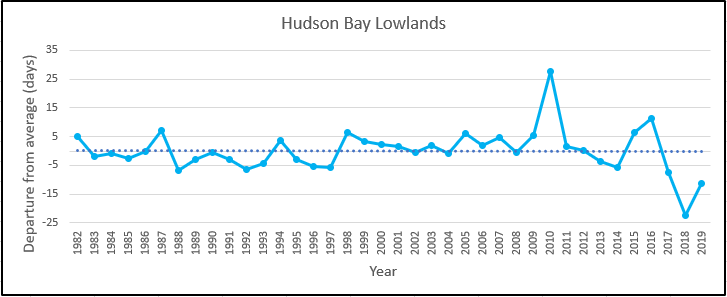
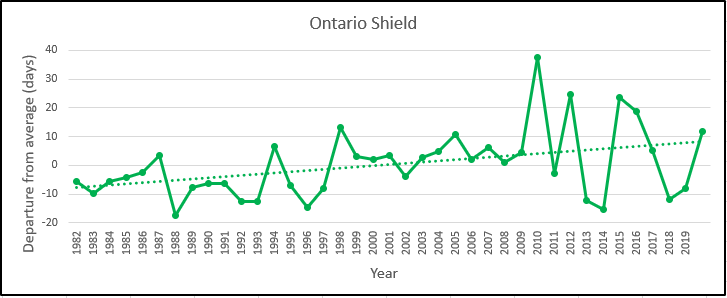
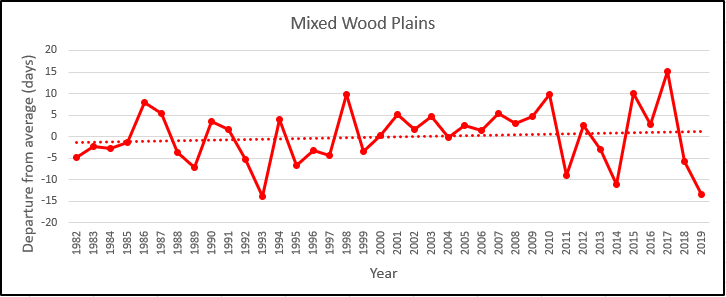
Figure 2. Trend in the departure from 37-year average duration of growing season over the period 1982–2019. Duration of growing season calculated using province wide bi-weekly satellite image based NDVI, summarized for each ecozone. Positive departures indicate a longer than average season, while negative departures indicate a shorter than the average season.
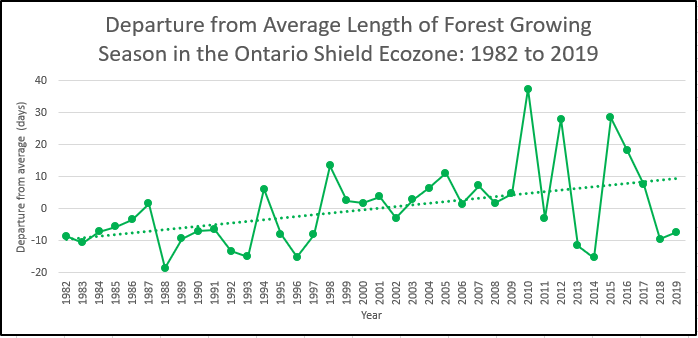
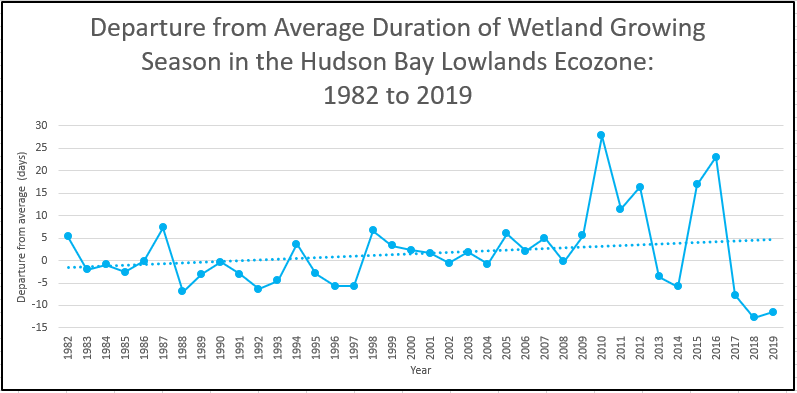
Figure 3. Trend in the departure from 37-year average duration of growing season in over the period 1982–2019. Duration of growing season calculated for using bi-weekly satellite image based NDVI, summarized for forested areas in the Ontario Shield ecozone and wetland areas in the Hudson Bay Lowlands. Positive departures indicate a longer than average season, while negative departures indicate a shorter than the average season.
Table 1. Range in duration of the growing season per decade.
| Ecozone |
1981–1990 |
1991–2000 |
2001–2010 |
2011–2020 |
Total |
| Hudson Bay Lowlands |
14.0 |
13.0 |
28.4 |
33.6 |
50.0 |
| Ontario Shield |
20.8 |
28.0 |
41.4 |
40.0 |
54.8 |
| Mixedwood Plains |
15.1 |
23.6 |
10.0 |
28.6 |
28.9 |
Status:
- Figure 1 shows that there is spatial variability of duration and start of vegetative growing season within ecozones and ecoregions (Figure 1).
- Figure 1 shows the duration of the vegetative growing season in the majority of the Ontario Shield has strong or moderate statistically significant annual trend, indicating that as time progresses vegetative growing season is getting longer.
- Figure 1 shows start of the vegetative growing season in southern portions of the Ontario Shield ecozone (i.e. ecoregions 4W, 4E, 5E and the southern portion of 3E) has strong or moderate statistically significant annual trends, indicating that as time progresses the vegetative growing season is starting earlier. The remainder of this ecozone shows no statistically significant start of growing season trend.
- Duration and start of vegetative growing season trends in the Hudson Bay Lowlands ecozone are mixed (Figure 1). The southern and central portions show strong or moderate statistically significant trends, indicating that as time progresses in these areas the vegetative season growing starts earlier and gets longer. Conversely, the area adjacent to the Hudson Bay coast (i.e. 0E) shows moderate or strong statistically significant trends towards shorter growing seasons starting later.
- Any interpretation of statistical trends in Figure 1 for the Mixedwood Plains should be considered with caution. Trends in this area are heavily influenced by urbanization and agriculture for which the duration and start of vegetative growing season are at least partially controlled by humans (planting long season wheat crops). That said, the more natural areas in the northern portion of this ecozone and the Bruce Peninsula indicate as time progresses vegetative growing seasons are getting longer and starting earlier.
- When averaged by ecozone the length of the growing season has increased in all three ecozones.
- A time series analysis (Thiel-Sen’s slope) showed average growing season lengths have increased on average by 7.4, 14.8, and 3.7 days for the Hudson Bay Lowland, Ontario Shield and Mixedwood Plains ecozones respectively. Increases in growing season length were also reported previously (SOBR 2015) but results were not statistically significant when tested with the Mann-Kendall test. The change noted for the Ontario Shield ecozone is now statistically significant.
- The Ontario Shield ecozone shows the greatest departure from average growing season and start of growing season, with growing season on average being longer and starting earlier.
- Forests in the Ontario Shield ecozone, where the bulk of Ontario’s forests are, saw an average increase of 18.5 days in the length of growing season.
- Wetlands in the Hudson Bay Lowlands, where the bulk of Ontario’s wetlands are, saw an average increase of 8.5 days length of growing season but the increase is not yet statistically significant.
- Table 1 and figures 2 and 3 show growing season gets longer and more variable. As well, there is more variability in the 2 northern ecozones of the province, similar to climate projections that indicate northern parts of the province will see more change than the south.
- The annual variability in temperatures is greater in the last 2 decades than previous decades as climate change impacts increase, further affecting biodiversity. Similar increases in variability have been shown in other indicator reports e.g. Changes in ice cover on the Great Lakes.
Additional information
Though analysis shows that overall Ontario continues to experience an earlier and longer vegetative growing season, some variation does exist in parts of the province. These variations can be explained by environmental, technological, and climatic factors. For example, in studying trends in both length of growing season and vegetative productivity in the Northern Hemisphere (> 30 lat) Wang and Fensholt (2017) found increases in both growing season length and vegetative productivity in forested ecosystems. Conversely, they found both increasing and decreasing length of growing season and vegetative productivity in non-forested ecosystems (e.g. grasslands, shrublands, savannahs).
Land management practices that help vegetative growth can help explain some variance. While the image resolution of analysis also impacts results. Areas of continuous forest in the Ontario Shield are generally much larger than 8km x 8km in size. Trends are therefore sufficiently captured at this resolution. Leaves and grasses are smaller in the Hudson Bay Lowlands and the majority of land cover features (i.e. wetlands) are more prone to different image reflectance responses. One 8km pixel is more likely to contain a combination of smaller tree/shrub leaves, narrow grasses, water and vegetation lacking a chlorophyl response. This is more likely to inhibit trend detection.
A deteriorating trend between 2002 and 2012 can be also be partially explained by a warming hiatus that has been widely observed by the scientific community (Wang et. al., 2019). The hiatus has been attributed to decreases in sea surface temperature in the eastern pacific due to increased strength and occurrences of the La Nina phenomenon which is a known natural Pacific Ocean surface temperature cycle.
Lastly, a recent study on temperate forests in Europe found that warmer spring temperatures are causing trees to leaf out earlier and that warmer temperatures in the fall are having the opposite effect. Researchers found that warming in the fall is in fact delaying spring leaf out in the following year, this may be due to the warming temperature causing a delay in the leaves going into deep dormancy before they can begin to leaf out again.
Previous version: Indicator – Changes in Vegetative Phenology_May 2015
Many wild species depend on climate conditions, such as temperature and rainfall patterns to survive. Predators and prey, insects and host plants, parasites and host insects, and insect pollinators and flowering plants have close interactions and depend on each other for survival. Increasing temperatures can cause the timing of important life cycle events to become out-of-sync (Parmesan and Yohe 2003; Crick 2004; Parmesan 2006). Over the last 70 years in Ontario, the annual mean temperature has increased by 1.3 oC with the largest increase (2 oC) in winter (Zhang et al 2019) Increases in the average annual air temperature vary across the province with smaller increases in the southeast and larger increases (of 1.3 oC) in the Northwestern part of the province (Environment Canada 2009). It is projected that by 2050, the average annual air temperature in Ontario will increase by 2.5 to 3.7 oC over 1961–1990 levels based on a scenario of moderate reductions in greenhouse gas emissions (Environment Canada 2009). Between 1948–2016, temperatures in Canada have increased at roughly double the global mean rate, with Canada’s mean temperature having risen about 1.7°C. Globally, 2020 was the hottest year on record, effectively tying 2016, the previous record (NASA, 2021)
Changes in climatic variables such as temperature can affect biodiversity both directly and indirectly and as such, can affect species in a variety of complex and interrelated ways. For example, species distribution may shift as southern species move northward, the timing of natural events, known as Phenology, including flowering or migration. Changes in phenology have trickle down effects for a host of other species, including insects, parasites, and pollinators that depend on vegetation for survival.
In addition to affecting the distribution of species directly (e.g. northward shift of southern species), increasing temperatures can affect the timing of natural events (phenology) like the flowering of plants and the breeding and migration of animals. In some cases interactions between species may be altered. An assessment of plant flowering data for 19 species across Canada (PlantWatch Canada 2013) showed that the average first flower bloom advanced by 9 days over the relatively brief period 2001—2012 (Gonsamo et al. 2013). Plants that begin growing earlier in the year due to warmer temperatures may be more susceptible to frost damage (Inouye 2008).
The Normalized Differenced Vegetation Index (NDVI) has been used by scientists for over 35 years to inventory, monitor and study various characteristics of vegetation. It is a well-established method of remotely measuring and monitoring vegetation using satellite imagery. Research has shown NDVI can successfully monitor and measure phenomena such as seasonal vegetation dynamics, forest clearance, percentage vegetative ground cover and photosynthetically active radiation (Lillesand and Kiefer 1994). Although NDVI observations can be influenced by solar radiation, characteristics of the sensor and atmospheric effects, it is an effective and efficient method for examining the effects of climate change on vegetation across broad spatial and temporal scales.
NDVI data are a generalized measure of the amount of greenness on the landscape and can be used to estimate important phenological events such as leaf out in the spring. For example, Chen and Yang (2020) looked at global phenological patterns using NDVI and found that vegetative growing season advanced/lengthened by approximately 2.36 days in middle to high latitudes (43.5˚N to 70.0 ˚N) in the Northern Hemisphere from 2001 to 2014. These results were confirmed with a moderately strong and statistically significant relationship with ground observations.
This indicator examines trends in vegetative phenology across Ontario from 1982–2019 to assess climate change impacts. Trends in the start and duration of the growing season are assessed here using satellite imagery. This indicator is important as publications both nationally and internationally state that earlier and longer growing seasons are known to increase vegetative productivity and diversity.
Web Links:
USGS – remote sensing phenology http://phenology.cr.usgs.gov/index.php
AppEEARS – LP DAAC – AppEEARS (usgs.gov)
PlantWatch Canada https://www.naturewatch.ca/plantwatch/
References:
Crick, H.Q.P. 2004. The impact of climate change on birds. Ibis 146 (Supplement 1):48-56.
Didan, K. (2015). MOD13A2 MODIS/Terra Vegetation Indices 16-Day L3 Global 1km SIN Grid V006. NASA EOSDIS Land Processes DAAC. Accessed 2021-04-09 from https://doi.org/10.5067/MODIS/MOD13A2.006. Accessed April 9, 2021.
AppEEARS Team. (2020). Application for Extracting and Exploring Analysis Ready Samples (AppEEARS). Ver. 2.58. NASA EOSDIS Land Processes Distributed Active Archive Center (LP DAAC), USGS/Earth Resources Observation and Science (EROS) Center, Sioux Falls, South Dakota, USA. Accessed April 9, 2021. https://lpdaacsvc.cr.usgs.gov/appeears
Environment Canada. 2009. Ensemble scenarios for Canada, 2009. Produced by the Canadian Climate Change Scenarios Network (CCCSN.CA). N. Comer (ed.). Adaptation and Impacts Research Division, Environment Canada, Ottawa, ON.
Gonsamo, A., J.M. Chen, and C. Wu. 2013. Citizen science: linking the recent rapid advances of plant flowering in Canada with climate variability. Scientific Reports 3, Article number: 2239.
Hogg, A. et al. 2015. Understanding the effects of climate change on Ontario’s natural resources. DRAFT– Ministry of Natural Resources and Forestry Climate Change Research Report, Peterborough, ON
Inouye, D.W. 2008. Effect of climate change on phenology, frost damage, and floral abundance of montane wildflowers. Ecology 89:353-362.
Jönsson, P., and L. Eklundh. 2004. TIMESAT—a program for analyzing time-series of satellite sensor data. Computers and Geosciences 30:833–845.
Lillesand, T.M., and R.W. Kiefer. 1994. Remote Sensing and Image Interpretation. Third edition, John Wiley & Sons, Inc., New York.
McDermid, J., S. Fera and A. Hogg. 2015. Climate change projections for Ontario: An updated synthesis for policymakers and planners. Ontario Ministry of Natural Resources and Forestry, Science and Research Branch, Peterborough, Ontario. Climate Change Research Report CCRR-44.
Ontario Biodiversity Council. 2015 State of Ontario’s Biodiversity. Ontario Biodiversity Council, Peterborough, Ontario.
Parmesan, C. 2006. Ecological and evolutionary responses to recent climate change. Annual Review of Ecology, Evolution and Systematics 37:637-669.
Parmesan, C., and G. Yohe. 2003. A globally coherent fingerprint of climate change impacts across natural systems. Nature 421:37-42.
Tucker, C. J., J. E. Pinzon, and M. E. Brown. 2004. Global inventory modeling and mapping studies. Global Land Cover Facility, University of Maryland, College Park, MD.
Wang, Lanhui, and Rasmus Fensholt. 2017. Temporal Changes in Coupled Vegetation Phenology and Productivity are Biome-Specific in the Northern Hemisphere. Remote Sens. 2017, 9, 1277; doi:10.3390/rs9121277 .
Wang, X., Xiao, J. , Li, X., Cheng, G., Ma, M., Zhu, G. , Altaf Arain, M., Black, T.A., and R.S. Jassal. 2019. No trends in spring and autumn phenology during the global warming hiatus. NATURE COMMUNICATIONS | (2019) 10:2389 | https://doi.org/10.1038/s41467-019-10235-8 | www.nature.com/naturecommunications
Zhang, X., Flato, G., Kirchmeier-Young, M., Vincent, L., Wan, H., Wang, X., Rong, R., Fyfe, J., Li, G., Kharin, V.V. (2019): Changes in Temperature and Precipitation Across Canada; Chapter 4 in Bush, E. and Lemmen, D.S. (Eds.) Canada’s Changing Climate Report. Government of Canada, Ottawa, Ontario, pp 112-193 https://lamps.math.yorku.ca/OntarioClimate/ClimateTrendsandVariationsBulletin/index.htm


