A.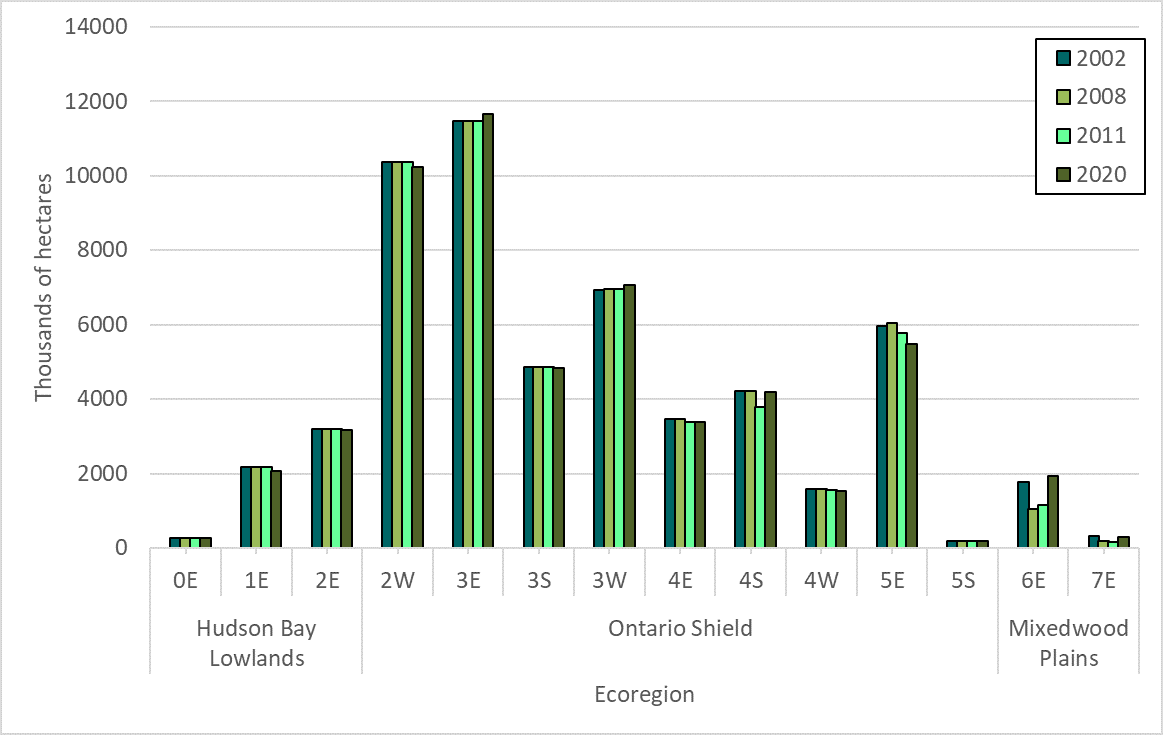
B.
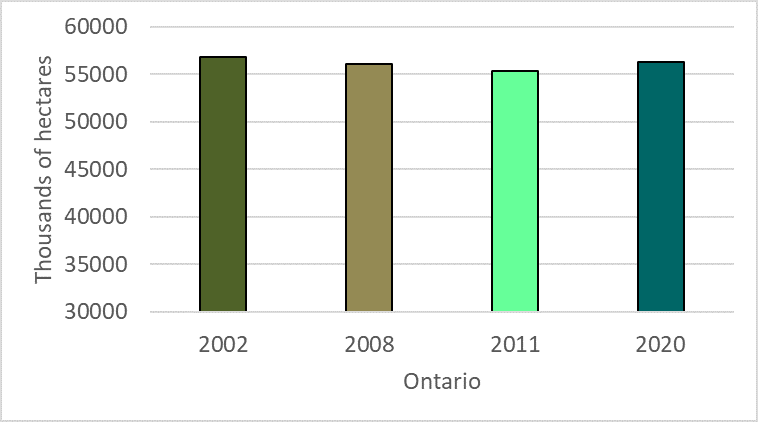
Figure 2. Total area of forested land by ecoregion in each ecozone (A) in 2002, 2008, 2011 and 2020 (Inset map – Ontario’s ecoregions) and area forested in total for Ontario (B). (OMNRF 2006; Watkins 2011, Forest Resources of Ontario 2016, 2021 ). Some changes can be attributed to improved data methodology.
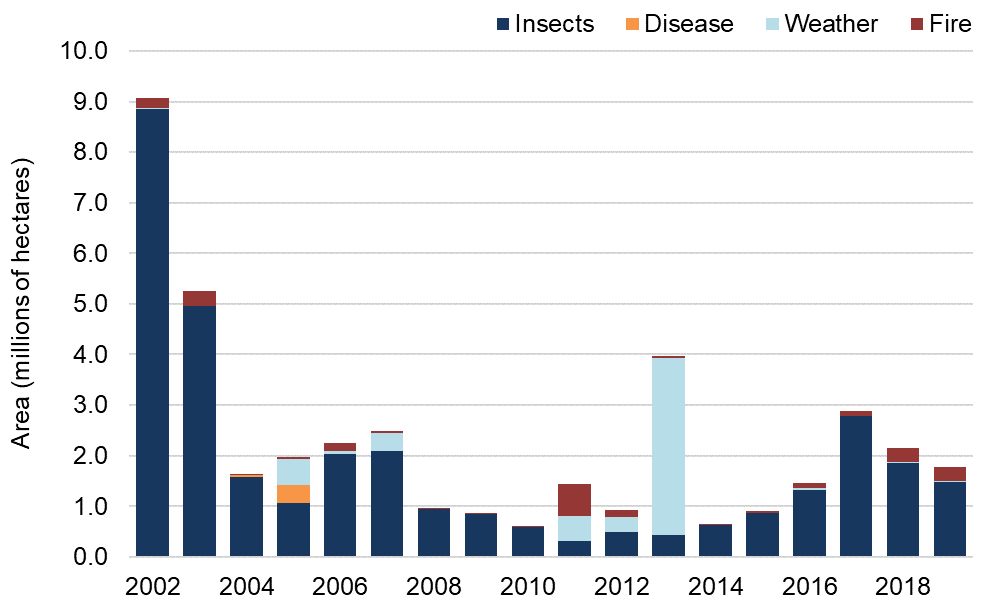
Figure 3. Total area within which disturbance from wildfire, weather, insects and disease occurred from 2002 to 2019 in millions of hectares (MNDMNRF 2021).
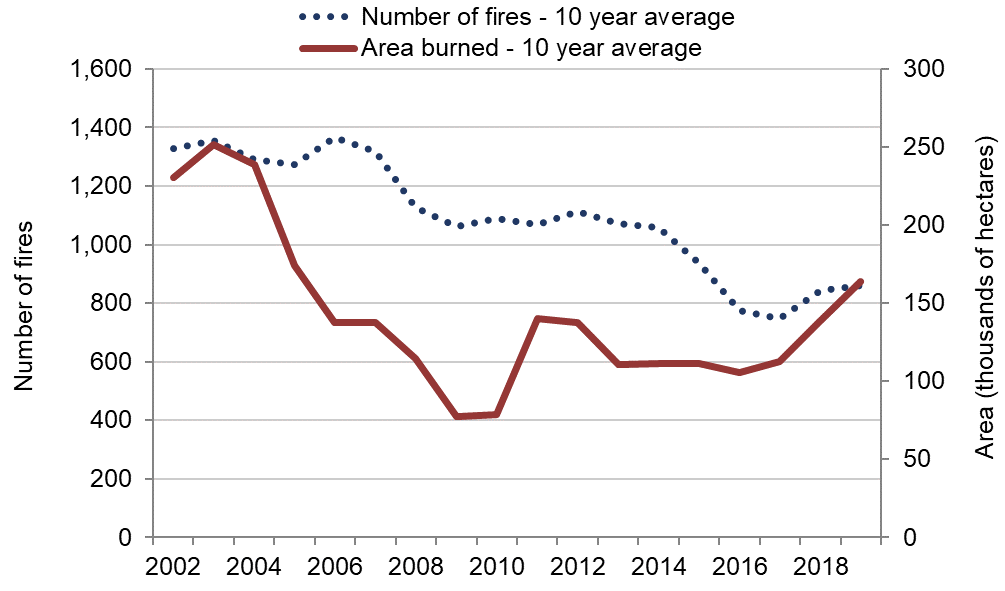
Figure 4. 10-year average area of Ontario forest burned and the number of fires from 2002–2019 (MNDMNRF 2021).
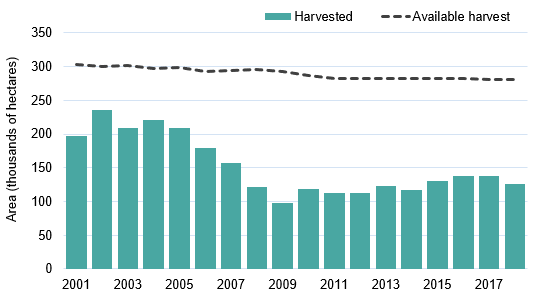
Figure 5. Forest area available for harvest and actual area harvested from 2001 to 2018 (MNDMNRF 2021).
Status:
- More than half (66%) of Ontario’s land base is forested, and 86% of the forested land (excluding treed wetlands) is found in the Ontario Shield Ecozone. In the SOBR 2015 report 88% of the forested land was in the Ontario Shield ecozone. These changes could be attributed to more accurate measurements and land reclassification.
- Disturbances associated with wildland fires is highly variable. Area of forests burned annually by wildfire in recent years (2015 to 2019) has steadily increased. A total of 3,889 fires burned approximately 774,279 hectares. The volume of loss from wildland fire was approximately 2.3 million cubic metres.
- Since 2002, there has been an overall declining trend in the number of fires. While the area burned declined until 2011, significant fires caused the area burned to increase. Between 2013 and 2017 the area burned was steady and began to increase again in 2018. Although most fires occur within the Managed Forest, they account for only 19% per cent of the area burned. There are fewer fires in the Far North, however they account for 81% of the area burned.
- From 2015–2019 there was an increase in the area disturbed by insects which can be attributed to naturally recurring cycles.
- The overall area disturbed by insects was 9.2 million hectares (13% of the provincial total forested area).
- Weather, specifically ice damage, affected a significant area in 2013.
- On average 121,000 hectares was harvested per year between 2015–2019, 44% of the approved area and volume that was available to harvest. In 2002–2013, SOBR reported that 152,540 hectares per year for the 2002–2013 period, a little more than 50% of the allowable harvest area.
- Between 2005 and 2010 there was a substantial decrease in annual forest harvest associated with a downturn in Ontario’s forest industry, however recent harvest levels have remained steady but are still lower than they have been historically.
Previous version: Forest cover and forest disturbance 2015
Forests cover an estimated 31% of the global land area (Food and Agriculture Organization of the United Nations 2020). Forests play a disproportionate role in maintaining biodiversity and ecosystem services as they provide habitat for half or more of terrestrial animal and plant species and contain 80% of all terrestrial biomass (living matter) (MEA 2005). In addition to habitat provision, forests sequester and store carbon, purify and store water, protect aquatic habitats, support soil retention, as well as provide recreational opportunities, fibre and timber. Forests also provide Ontarians with significant employment opportunities and economic benefits, and support traditional Indigenous and rights-based uses such as hunting and trapping.
Forest management plans ensure healthy forests now and into the future and provide a range of sustainable benefits such as timber and commercial products, wildlife habitat and recreational opportunities. In Ontario, forest management plans are updated every 10 years, the updates account for the impacts of natural disturbances and volume losses (MNDMNRF 2021).
Ontario has 70.5 million hectares of forest including productive forest (suitable for timber production), hedgerows and treed wetlands representing 2% of the world’s forests and 20% of Canada’s forest (MNDMNRF 2021). More than half (66%) of Ontario’s land base is forested (MNDMNRF 2021) — Figure 1. Ontario’s forests include a broad range of tree species across three ecozones.
The current extent and composition of Ontario’s forests are closely related to climate and landscape characteristics, such as soil and topography, as well as landscape history. Forests in areas of the province with soil and topography relatively better suited to agriculture and settlement have been most altered. The structure and composition of forests is also affected by timber harvest, fire, insects, disease, forest fragmentation and climate change. Permanent loss of forest cover and isolation of current populations through conversion to other uses (e.g., residential, industrial, agricultural) negatively impacts forest-dependent species and their ability to reproduce. Forest disturbances such as fire, insect damage and timber harvest change the age and composition of forests, but the forest cover on the landscape is maintained through regeneration. Fire is a vital ecological component of the boreal forest ecosystem. In some cases large levels of disturbance, such as extreme fire events and major ice storms, can influence and change the species composition of an ecosystem, while the absence of disturbances such as fire or floods may impact biodiversity as well.
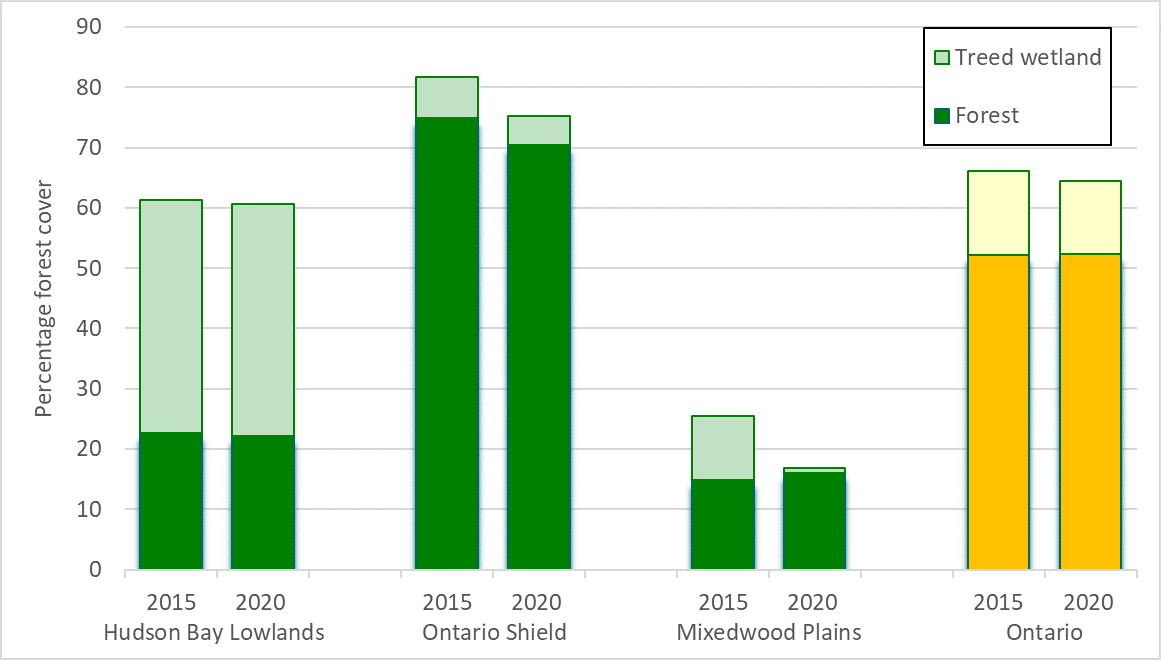
Figure 1. Percent forest cover for Ontario ecozones and entire province as presented in SOBR 2015 report and 2020. (TheForestResourcesofOntario2021 | Tableau Public).
Note: Some changes can be attributed to improved data methodology.
This indicator examines the total area of forest in Ontario’s ecoregions and the area of disturbed forest as a result of fire and harvest between 2002 and 2020. Information on the amount of actual harvest versus allowable levels for the period 2002–2018 is also included.
The information presented for this indicator represents a summary of the State of Resource Reporting: Natural Disturbances in Ontario report (MNDMNRF 2021).
The area of forested land in each of Ontario’s 14 ecoregions was compared over time (2002 –2020) based on detailed information presented in the Forest Resources of Ontario (OMNRF 2006; Watkins 2011, Archived – Forest Resources of Ontario 2016, Forest Resources of Ontario 2021 — Figure 2). Information on the area of forest disturbance (burns, weather, insects and disease and harvest within the previous 10-year period) were also assessed (Figure 3). The areas with burns also include a small amount of area attributed to other stand-replacing disturbances (severe blowdown).
The annual area of forest harvest compared with the allowable harvest area for Ontario’s Crown forest management units from the period 2001–2018 are also presented (Figure 4). This information is maintained by the Ontario Ministry of Northern Development, Mines, Natural Resources and Forestry and is summarized in Annual Reports on Forest Management and the State of Ontario’s Forest Report (MNDMNRF 2021). Allowable harvest areas are determined through modelling of the age distribution and productivity of forest classes in each forest management unit during the development of forest management plans.
The area disturbed is the gross total area within which disturbances occurred including all forest and ownership categories and all severities of disturbance (weather, insects and disease). Not all disturbances have the same effect. Tree mortality and volume loss vary depending on the type of disturbance and the type of forest where the disturbance occurs (MNDMNRF 2021).
Many factors can play a role in the severity of the disturbances. Wildland fires or extreme weather can cause tree mortality and affect volume loss. However, in younger forests volume loss will be lower. Insects and diseases can cause less damage however, infestations recurring over time can become a problem for tree survival and ability to reproduce or regenerate naturally. While fire, insects, weather and diseases are all part of the forest ecosystem, introduction of new species and disease, as well as extreme fire events driven by climate change, especially on stressed or isolated populations, can be detrimental to the forest.
The MNDMNRF’s forest health monitoring program in partnership with the Canadian Forest Service conducts annual surveys of insects, diseases and weather events causing forest disturbances. For disturbances, volume loss within the Managed Forest is calculated for the Crown forest only. The Managed Forest is an area in the middle of the province (from Kemptville in the south east to Pikangikum in the north west and includes parts of the Boreal Forest and the Great Lakes – St. Lawrence forest) where forest management occurs on public land. It has a large quantity of productive forest that is suitable for timber production. Wildland fire data is collected annually by the MNDMNRF’s fire management program. The data is subdivided to show wildfire within and north of the Managed Forest. Data is from within Ontario’s Fire Region as fires outside the area have little crown land and are suppressed by local municipal fire departments, with assistance from the ministry as requested (MNDMNRF 2021).
As data collection methods improve and are effectively implemented and enforced it can affect comparison of the data in the past and therefore some changes can be attributed to the more accurate measurements and improved data methodology. Data comparisons can also show the positive or negative effects on the land over time.
This indicator cannot be readily compared to previous reports because of the revised data sources and methods used and therefore earlier SOBR reports with data from the 1990s have been removed for this indicator report.
Related Target(s)
Related Themes:
Conservation Response – Sustainable Management
Web Links:
Ontario Ministry of Natural Resources and Forestry – Sustainable Forest Management https://www.ontario.ca/environment-and-energy/sustainable-forest-management
Forest Resources of Ontario 2011 https://www.ontario.ca/document/forest-resources-ontario-2011
State of Ontario’s Forests 2011 https://www.ontario.ca/document/state-ontarios-forests
Archived – Forest Resources of Ontario 2016: Geographic profiles | Ontario.ca
TheForestResourcesofOntario2021 | Tableau Public
State of Forests indicator reports: State of Ontario’s Natural Resources Forests 2021
References:
Millennium Ecosystem Assessment (MEA). 2005. Ecosystems and human well-being: biodiversity synthesis. World Resources Institute, Washington, DC.
Ontario Ministry of Natural Resources (OMNR). 2001. Forest resources of Ontario 2001: State of the Forest Report 2001. Queen’s Printer for Ontario, Toronto, ON.
Ontario Ministry of Natural Resources (OMNR). 2006. Forest resources of Ontario 2006: State of the Forest Report 2006. Queen’s Printer for Ontario, Toronto, ON.
Ontario Ministry of Natural Resources (OMNR). 2008. Southern Ontario Land Resource Information System (SOLRIS) Phase 2 – Data Specifications Version 1.2. Ontario Ministry of Natural Resources, Peterborough, ON.
Ontario Ministry of Natural Resources (OMNR). 2012. State of Ontario’s Forests. Queen’s Printer for Ontario, Toronto, ON. [Available at: http://www.web2.mnr.gov.on.ca/mnr/forests/public/publications/SOF_2011/toc_main.pdf]
Watkins, L. 2011.The forest resources of Ontario 2011. Ontario Ministry of Natural Resources, Queen’s Printer for Ontario, Sault Ste. Marie, ON.
Genetic diversity — or the variation in genes in a species or population — is a fundamental source of biodiversity. For forests, it provides a basis for tree adaptation and resilience to environmental stress, pests, and diseases and contributes to community dynamics and ecosystem functioning (FAO 2015; Shaw et al. 2025). Human-caused disturbances such as greenhouse gases, landscape fragmentation, invasive species spread, and air and soil pollution affect how genes move and change, or even lo…
Read More


