This indicator provides an assessment of the potential impacts of climate change on biodiversity by examining trends in ice cover on the Great Lakes.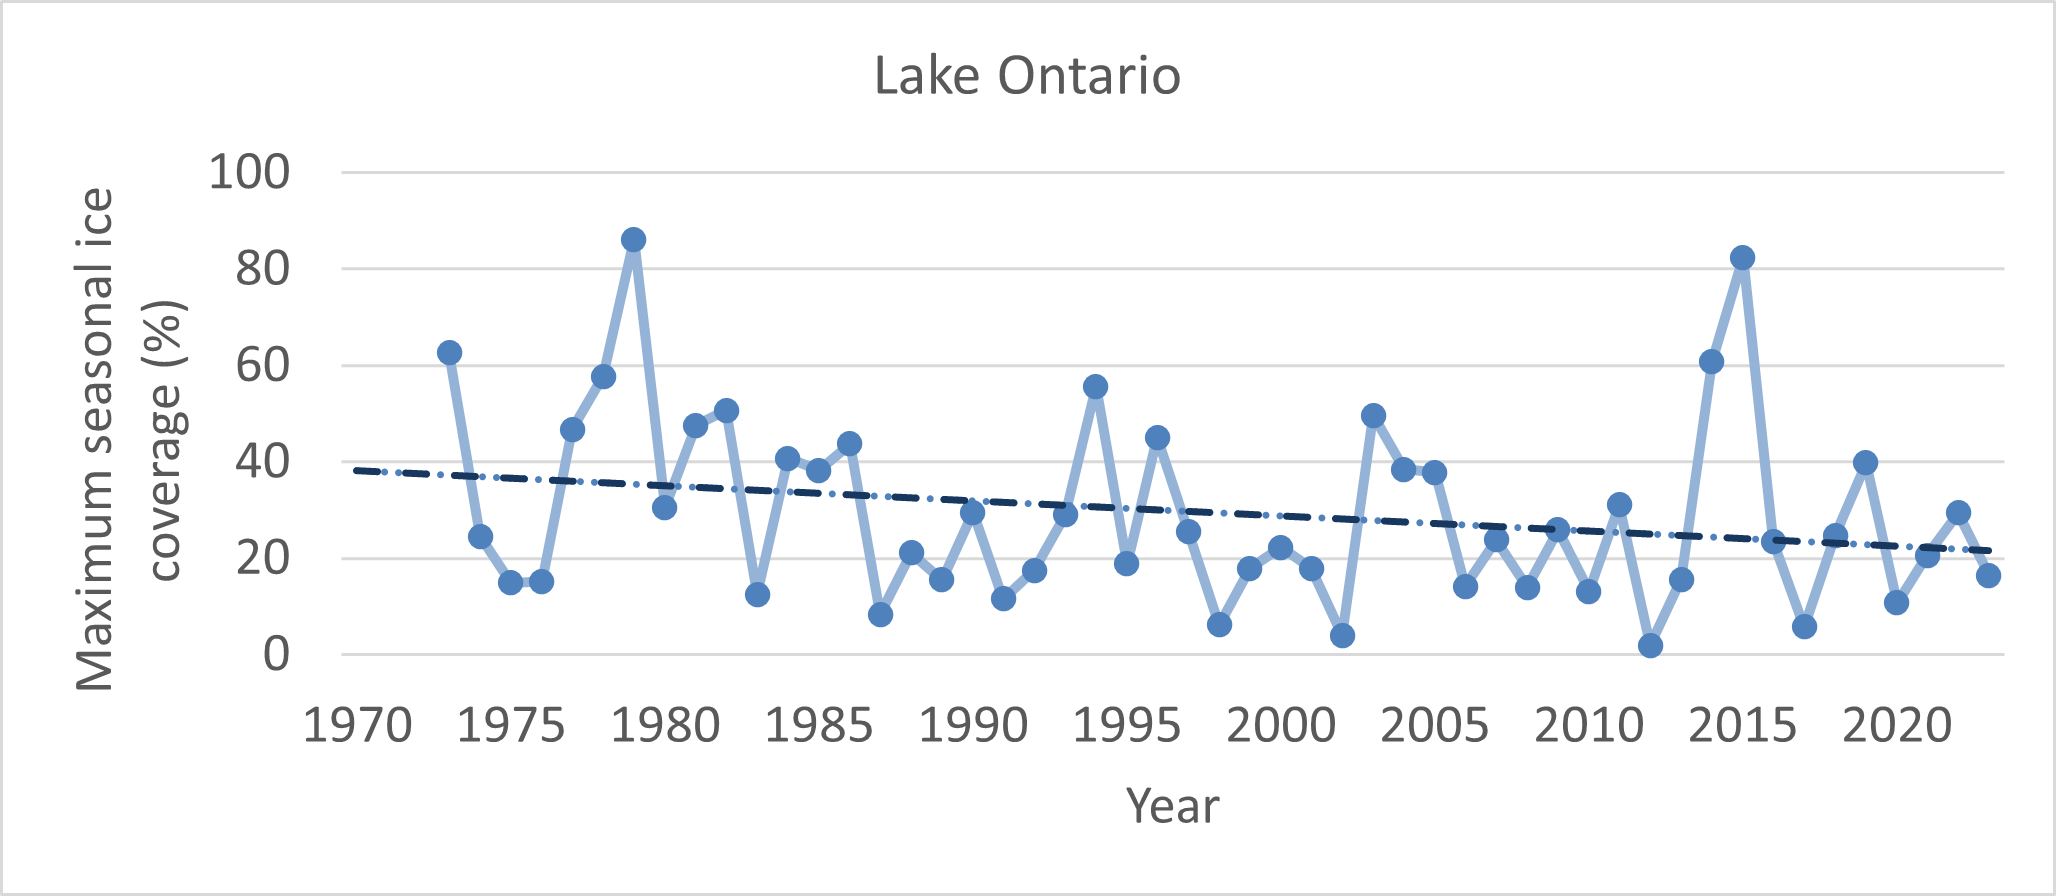
Figure 1. Maximum seasonal ice cover (% cover) on Lake Ontario from 1973 –2023. The dots indicate maximum ice cover of each year, the dashed line is the linear regression trendline for the same period (Source: National Oceanic and Atmospheric Administration (NOAA) NOAA/Great Lakes Environmental Research Laboratory (GLERL)).
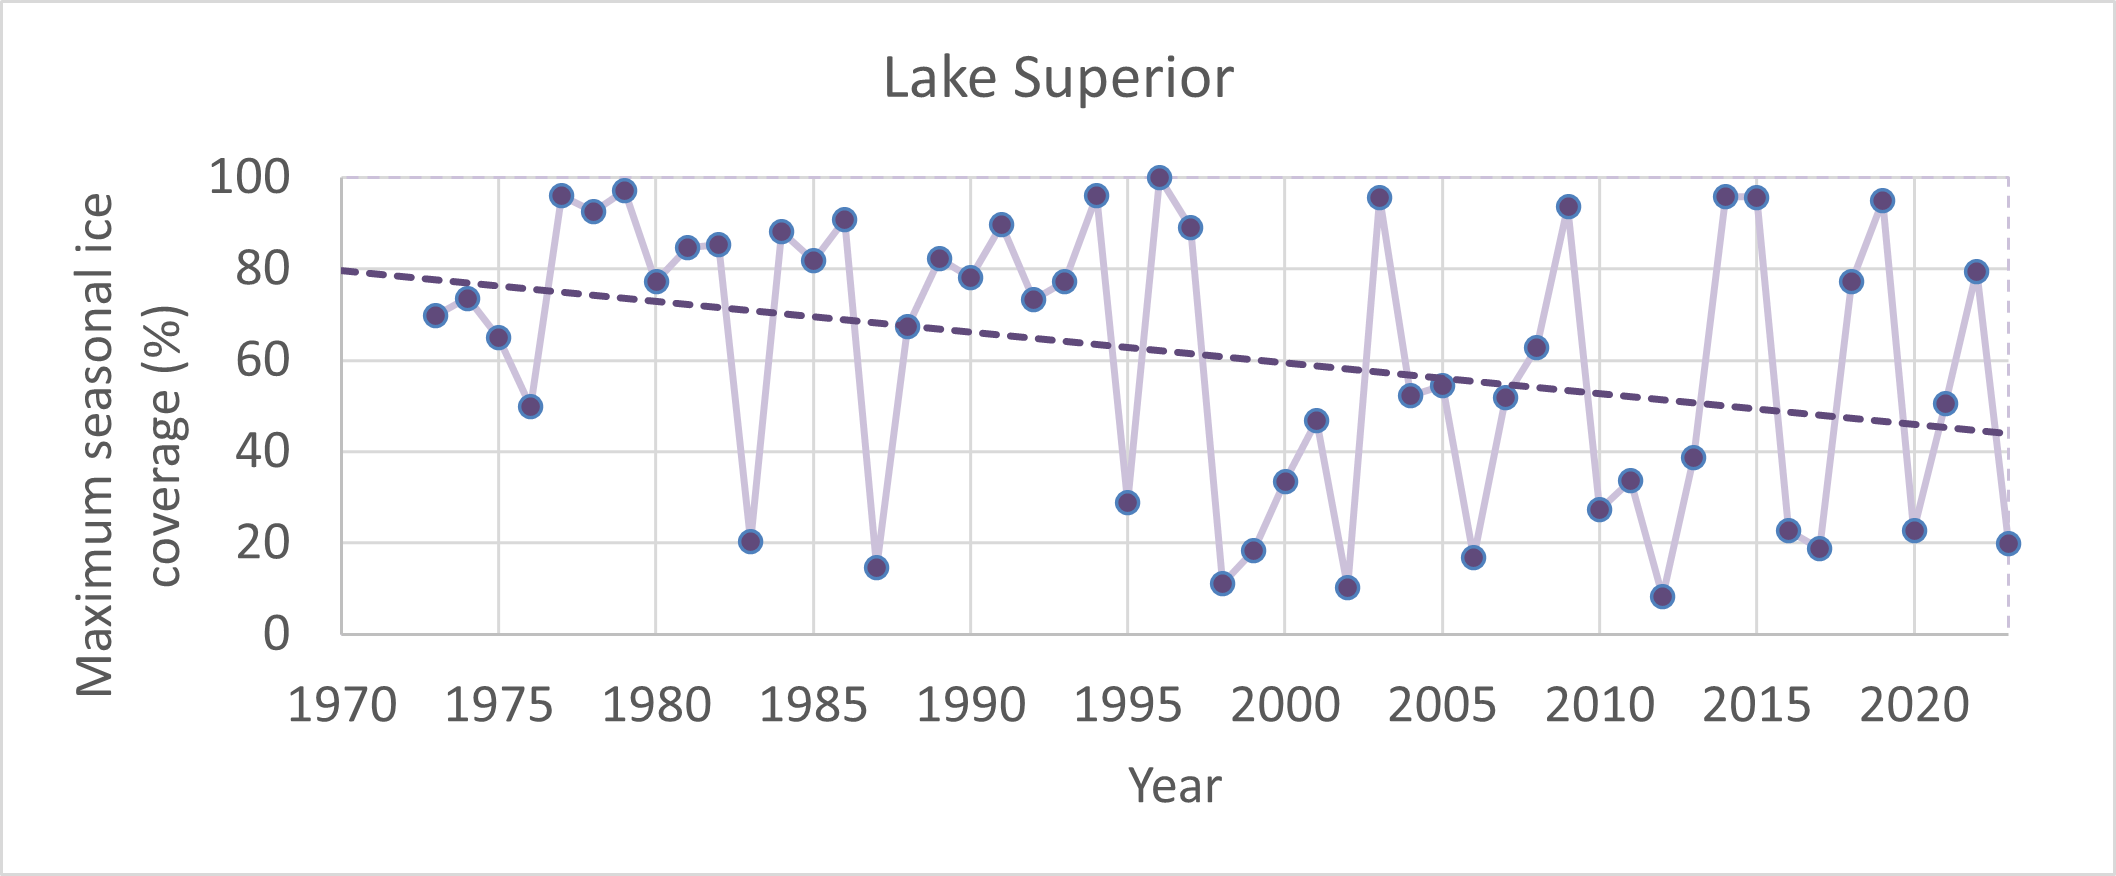 Figure 2. Maximum seasonal ice cover (% cover) on Lake Superior from 1973 –2023. The dots indicate maximum ice cover of each year, the dashed line is the linear regression trendline for the same period (Source: National Oceanic and Atmospheric Administration (NOAA) NOAA/Great Lakes Environmental Research Laboratory (GLERL)).
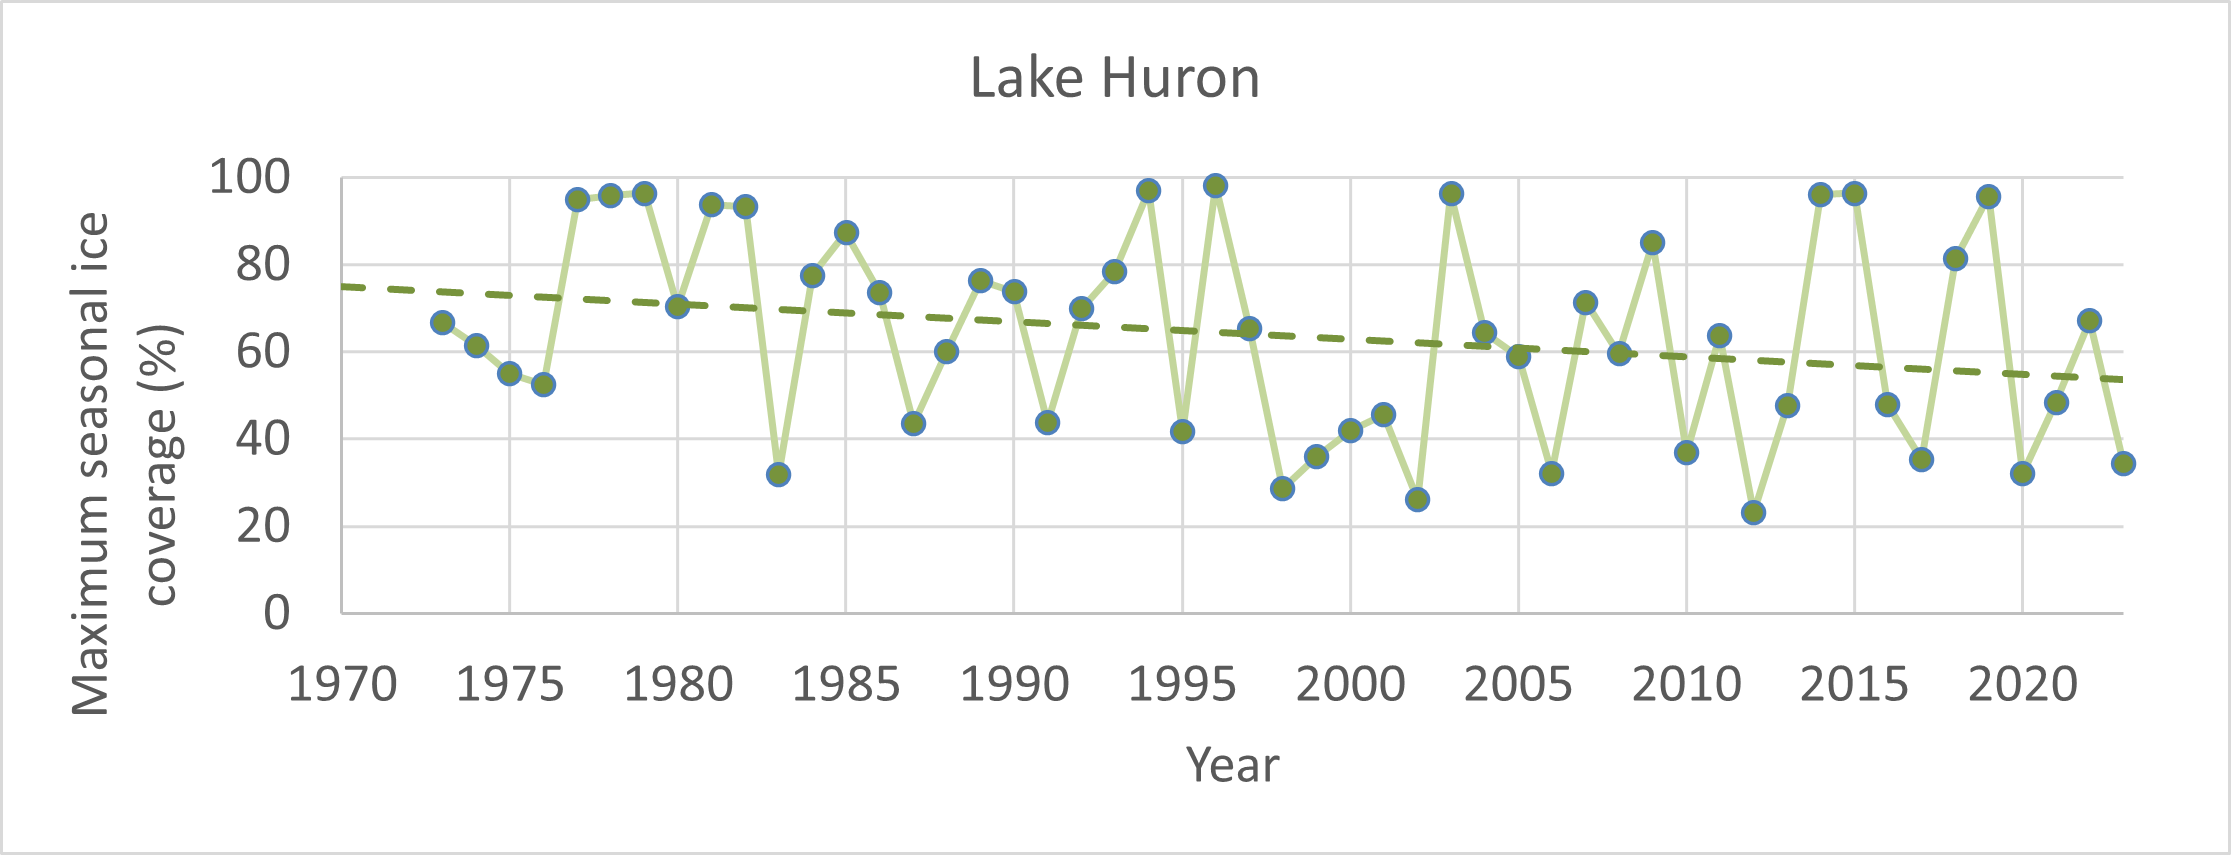 Figure 3. Maximum seasonal ice cover (% cover) on Lake Huron from 1973 –2023. The dots indicate maximum ice cover of each year, the dashed line is the linear regression trendline for the same period (Source: National Oceanic and Atmospheric Administration (NOAA) NOAA/Great Lakes Environmental Research Laboratory (GLERL)).
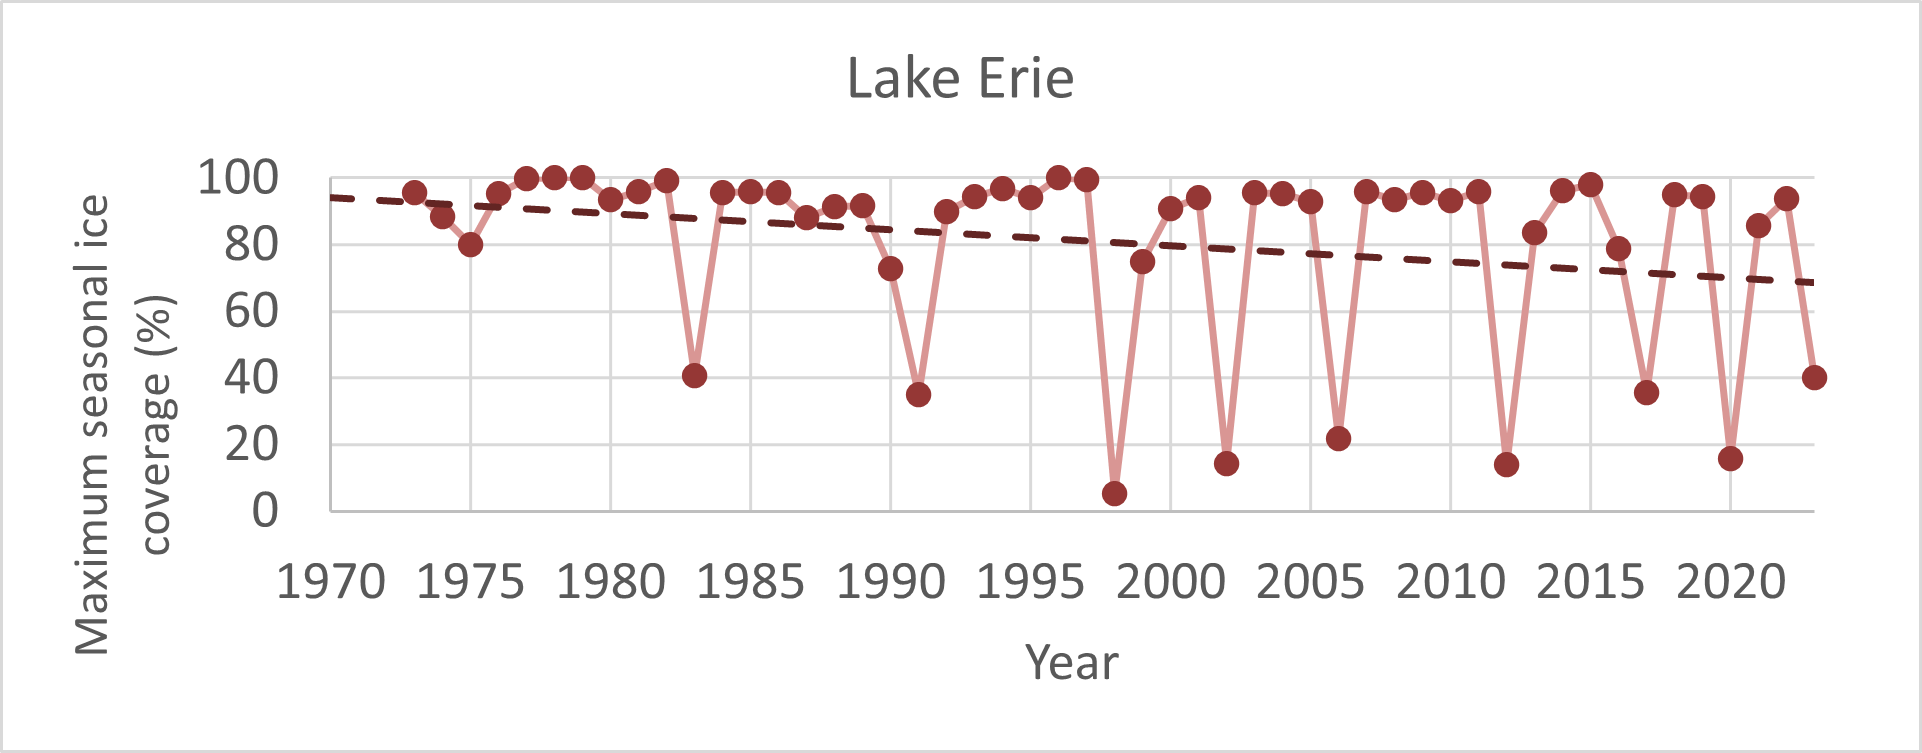 Figure 4. Maximum seasonal ice cover (% cover) on Lake Erie from 1973 –2023. The dots indicate maximum ice cover of each year, the dashed line is the linear regression trendline for the same period (Source: National Oceanic and Atmospheric Administration (NOAA)NOAA/Great Lakes Environmental Research Laboratory (GLERL)).
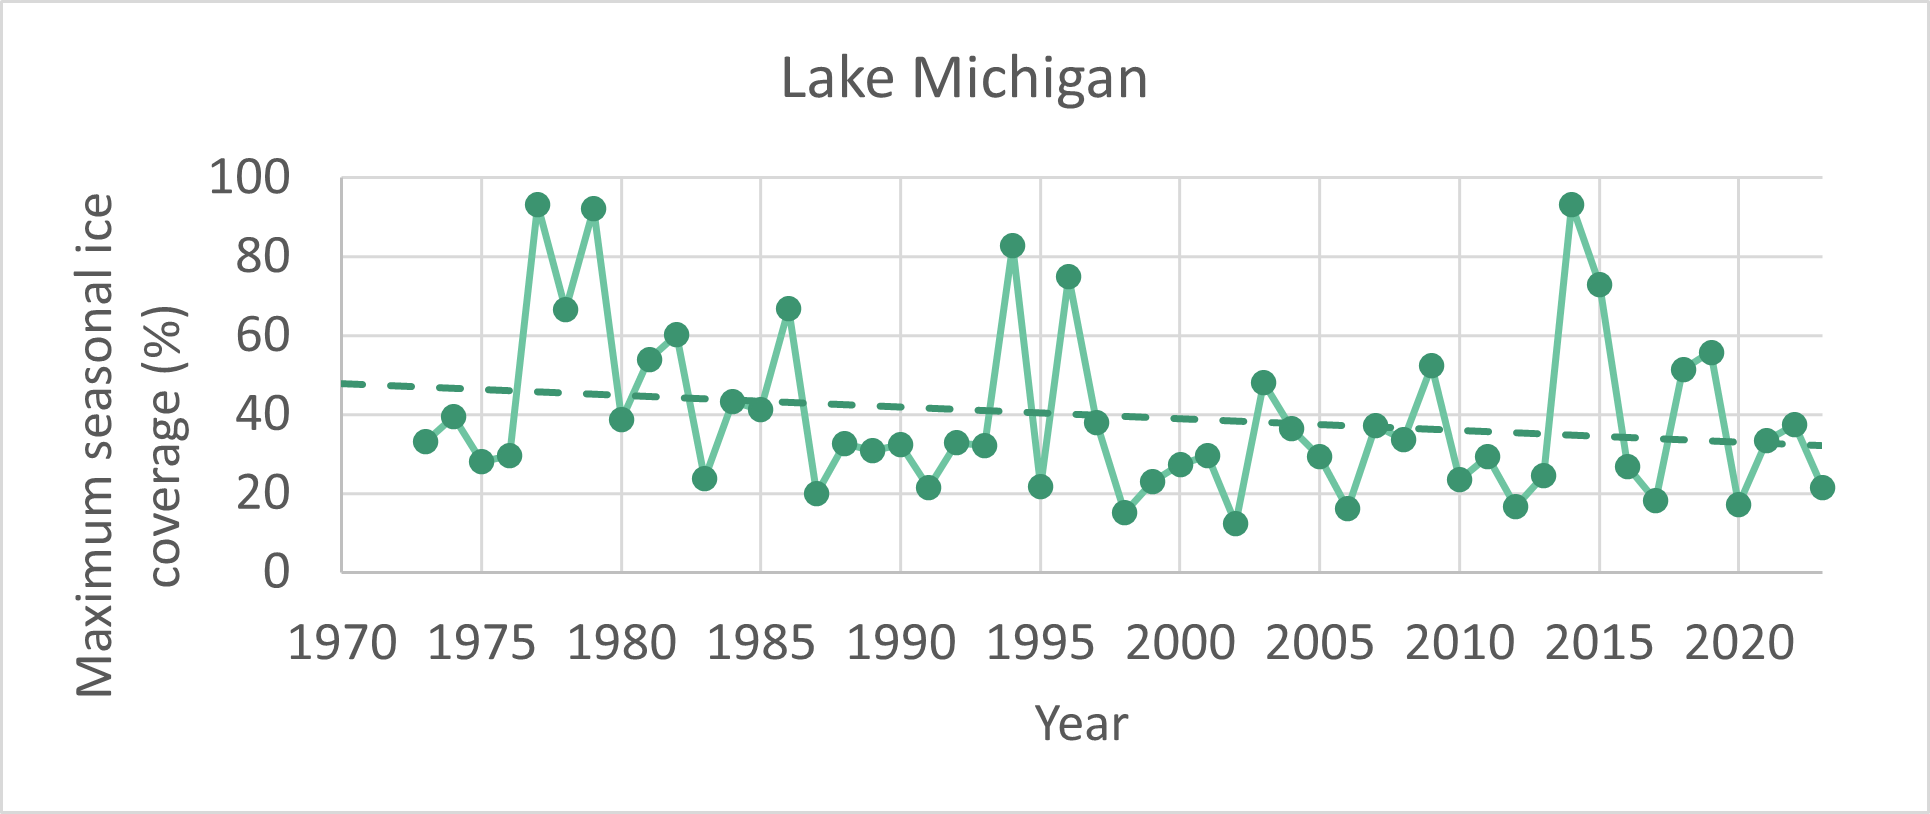 Figure 5. Maximum seasonal ice cover (% cover) on Lake Michigan from 1973 –2023. The dots indicate maximum ice cover of each year, the dashed line is the linear regression trendline for the same period (Source: National Oceanic and Atmospheric Administration (NOAA) NOAA/Great Lakes Environmental Research Laboratory (GLERL)).
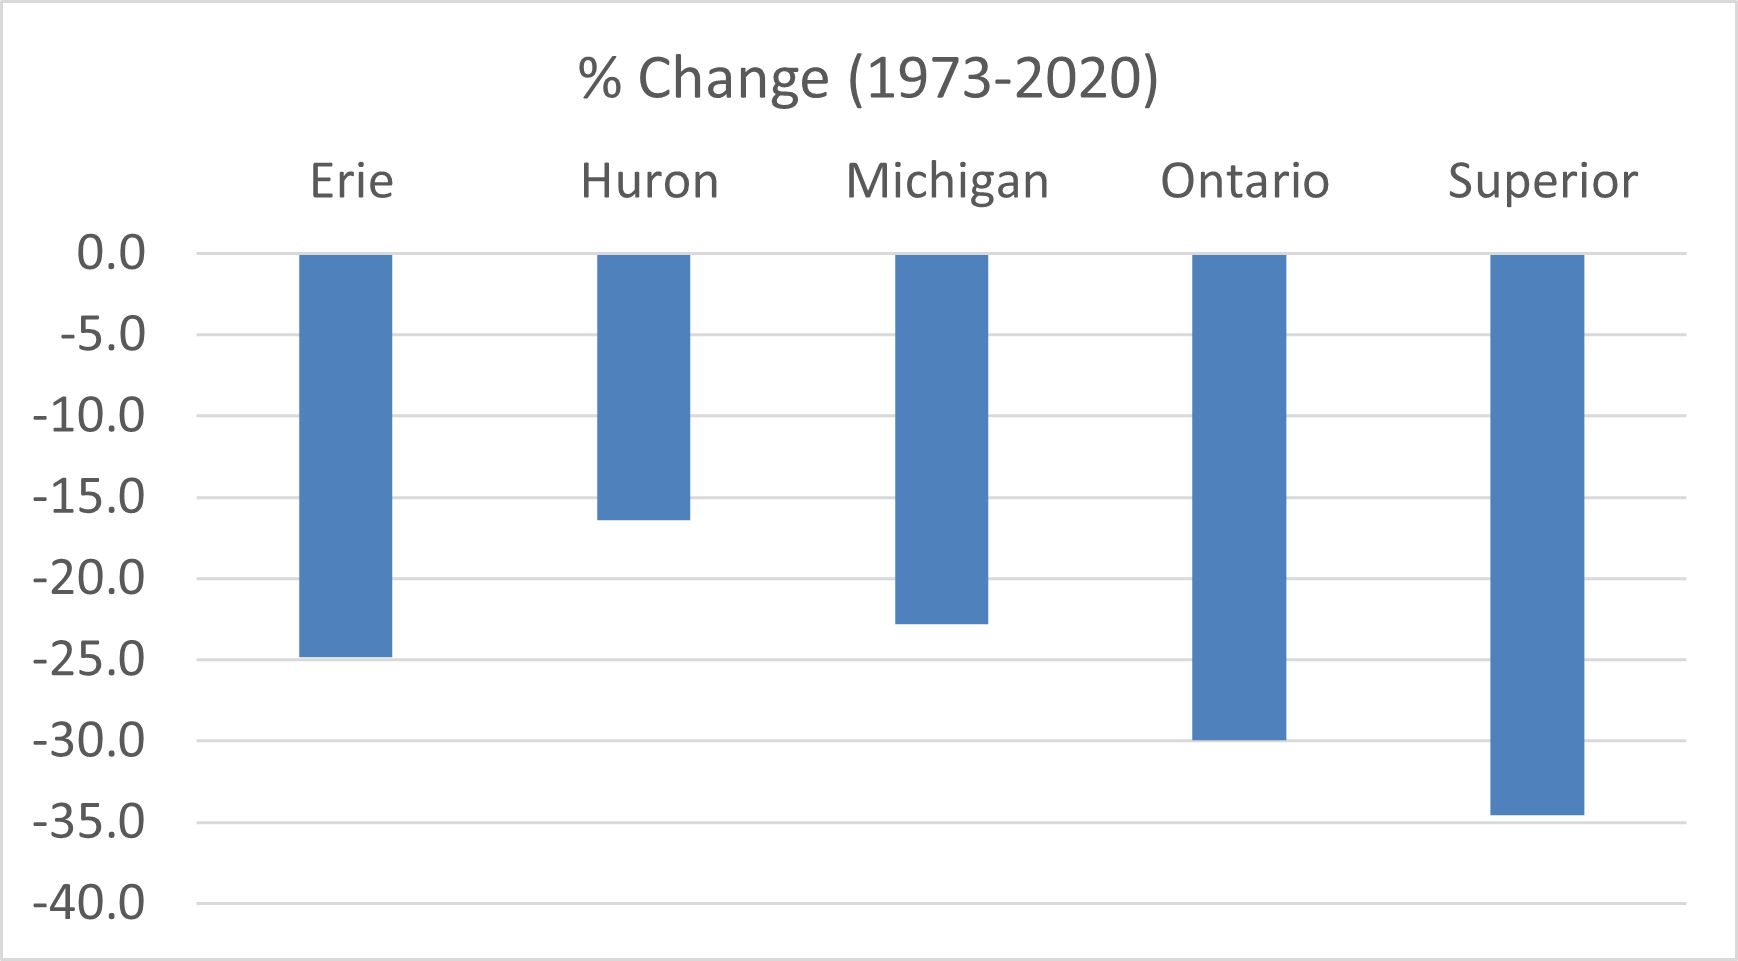
Figure 6: Mean decadal maximum ice coverage change from 1973-2020. Note: the average for the first decadal time period only includes data starting from the 1972/73 season—the year it was first available. Source: National Oceanic and Atmospheric Administration (NOAA) NOAA/Great Lakes Environmental Research Laboratory (GLERL).
Status:
- Despite inter-annual variation, the maximum seasonal extent of Great Lakes ice cover shows a long-term declining trend between 1973-2023.
- Over the same time period, mean decadal maximum ice cover has also declined by varying extents for all five of the Great Lakes.
- Between 1973-2020, mean decadal maximum ice coverage declined the most on lakes Superior and Ontario (34% and 30%, respectively) followed by lakes Erie (25%), Michigan (23%), and Huron (16%).
Related Theme(s)
Related Target(s)
Web Links:
NOAA – Great Lakes Environmental Research Laboratory – Great Lakes Ice Cover https://www.glerl.noaa.gov/data/ice/
Canadian Ice Service https://www.canada.ca/en/environment-climate-change/services/ice-forecasts-observations/about-ice-service.html
References:
Assel, R.A. (1999) Great Lakes ice cover. In Lam, D. C., & Schertzer, W. M. (Eds.). Potential climate change effects on Great Lakes hydrodynamics and water quality. ASCE Publications.
Douglas, A. G. and Pearson, D. (2022). Ontario; Chapter 4 in Canada in a Changing Climate: Regional Perspectives Report, (ed.) F.J. Warren, N. Lulham, D.L. Dupuis and D.S. Lemmen; Government of Canada, Ottawa, Ontario.
Environment Canada (EC) and the U.S. Environmental Protection Agency (USEPA). 2014. State of the Great Lakes 2011. Cat No. En161-3/1-2011E-PDF. EPA 950-R-13-002. [Available at: https://publications.gc.ca/collections/collection_2014/ec/En161-3-1-2011-eng.pdf]
Environment Canada (EC) and the U.S. Environmental Protection Agency (USEPA). 2009. State of the Great Lakes 2009. Cat No. En161-3/1-2009E-PDF. EPA 905-R-09-031. [Available at: https://publications.gc.ca/collections/collection_2009/ec/En161-3-2009E.pdf]
Goldman, C.R., M. Kumagai, and R.D. Robarts. (eds). 2013. Climatic change and global warming of inland waters: impacts and mitigation for ecosystems and societies. John Wiley & Sons, Ltd, Chichester, U.K.
Groenwold, A.D., V. Fortin, B. Lofgren, A. Clites, C.A. Stow, and F. Quinn. 2013. Coasts, water levels and climate change: A Great Lakes perspective. Climate Change 120:697-711.
Hanrahan, J.L., S.V. Kravtsov, and P.J. Roebber. 2010. Connecting past and present climate variability to the water levels of Lakes Michigan and Huron. Geophysical Research Letters, 37, L01701.
Hellmann, J.J., K.J. Nadelhoffer, L.R. Iverson, L.H. Ziska, S.N. Matthews, P. Myers, A.M. Prasad, and M.P. Peters. 2010. Climate change impacts on terrestrial ecosystems in metropolitan Chicago and its surrounding, multi-state region. Journal of Great Lakes Research 36:74-85.
Magnuson, J. J., D. M. Robertson, B. J. Benson, R. H. Wynne, D. M. Livingstone, T. Arai, R. A. Assel, R. G. Barry, V. Card, E. Kuusisto, N. G. Granin, T. D. Prowse, K. M. Stewart, and V. S. Vuglinski. 2000. Historical trends in lake and river ice cover in the Northern Hemisphere. Science 289: 1743-1746 and Errata 2001 Science 291:254.
National Oceanic and Atmospheric Administration (NOAA). 2014. State of climate – Great Lakes Ice. March 2014. [Available at: https://www.ncdc.noaa.gov/sotc/national/2014/3/supplemental/page-4/ (Accessed July 18, 2014)]
Rosenzweig C. 2007. Assessment of observed changes and responses in natural and managed systems. pp. 79–131 In Parry, M.L., O.F. Canziani, J.P. Palutikof, P.J. van der Linden, C.E. Hanson,and others (eds). Climate change 2007—impacts, adaptation and vulnerability. Contribution of Working Group II to the Fourth Assessment Report of the Intergovernmental Panel on Climate Change. Cambridge University Press, Cambridge, U.K.
Wang, J., J. Kessler, F. Hang, H. Hu, A. Clites, and P. Chu. 2018. Great Lakes ice climatology update of winters 2012-2017: Seasonal cycle, interannual variability, decadal variability, and trend for the period 1973-2017. NOAA Technical Memorandum GLERL-170.

 Figure 2. Maximum seasonal ice cover (% cover) on Lake Superior from 1973 –2023. The dots indicate maximum ice cover of each year, the dashed line is the linear regression trendline for the same period (Source: National Oceanic and Atmospheric Administration (NOAA) NOAA/Great Lakes Environmental Research Laboratory (GLERL)).
 Figure 3. Maximum seasonal ice cover (% cover) on Lake Huron from 1973 –2023. The dots indicate maximum ice cover of each year, the dashed line is the linear regression trendline for the same period (Source: National Oceanic and Atmospheric Administration (NOAA) NOAA/Great Lakes Environmental Research Laboratory (GLERL)).
 Figure 4. Maximum seasonal ice cover (% cover) on Lake Erie from 1973 –2023. The dots indicate maximum ice cover of each year, the dashed line is the linear regression trendline for the same period (Source: National Oceanic and Atmospheric Administration (NOAA)NOAA/Great Lakes Environmental Research Laboratory (GLERL)).
 Figure 5. Maximum seasonal ice cover (% cover) on Lake Michigan from 1973 –2023. The dots indicate maximum ice cover of each year, the dashed line is the linear regression trendline for the same period (Source: National Oceanic and Atmospheric Administration (NOAA) NOAA/Great Lakes Environmental Research Laboratory (GLERL)).
