This indicator provides an assessment of trends in water quality of Ontario streams by examining three parameters that have a strong influence on stream biodiversity – chloride, nitrates and total phosphorus.

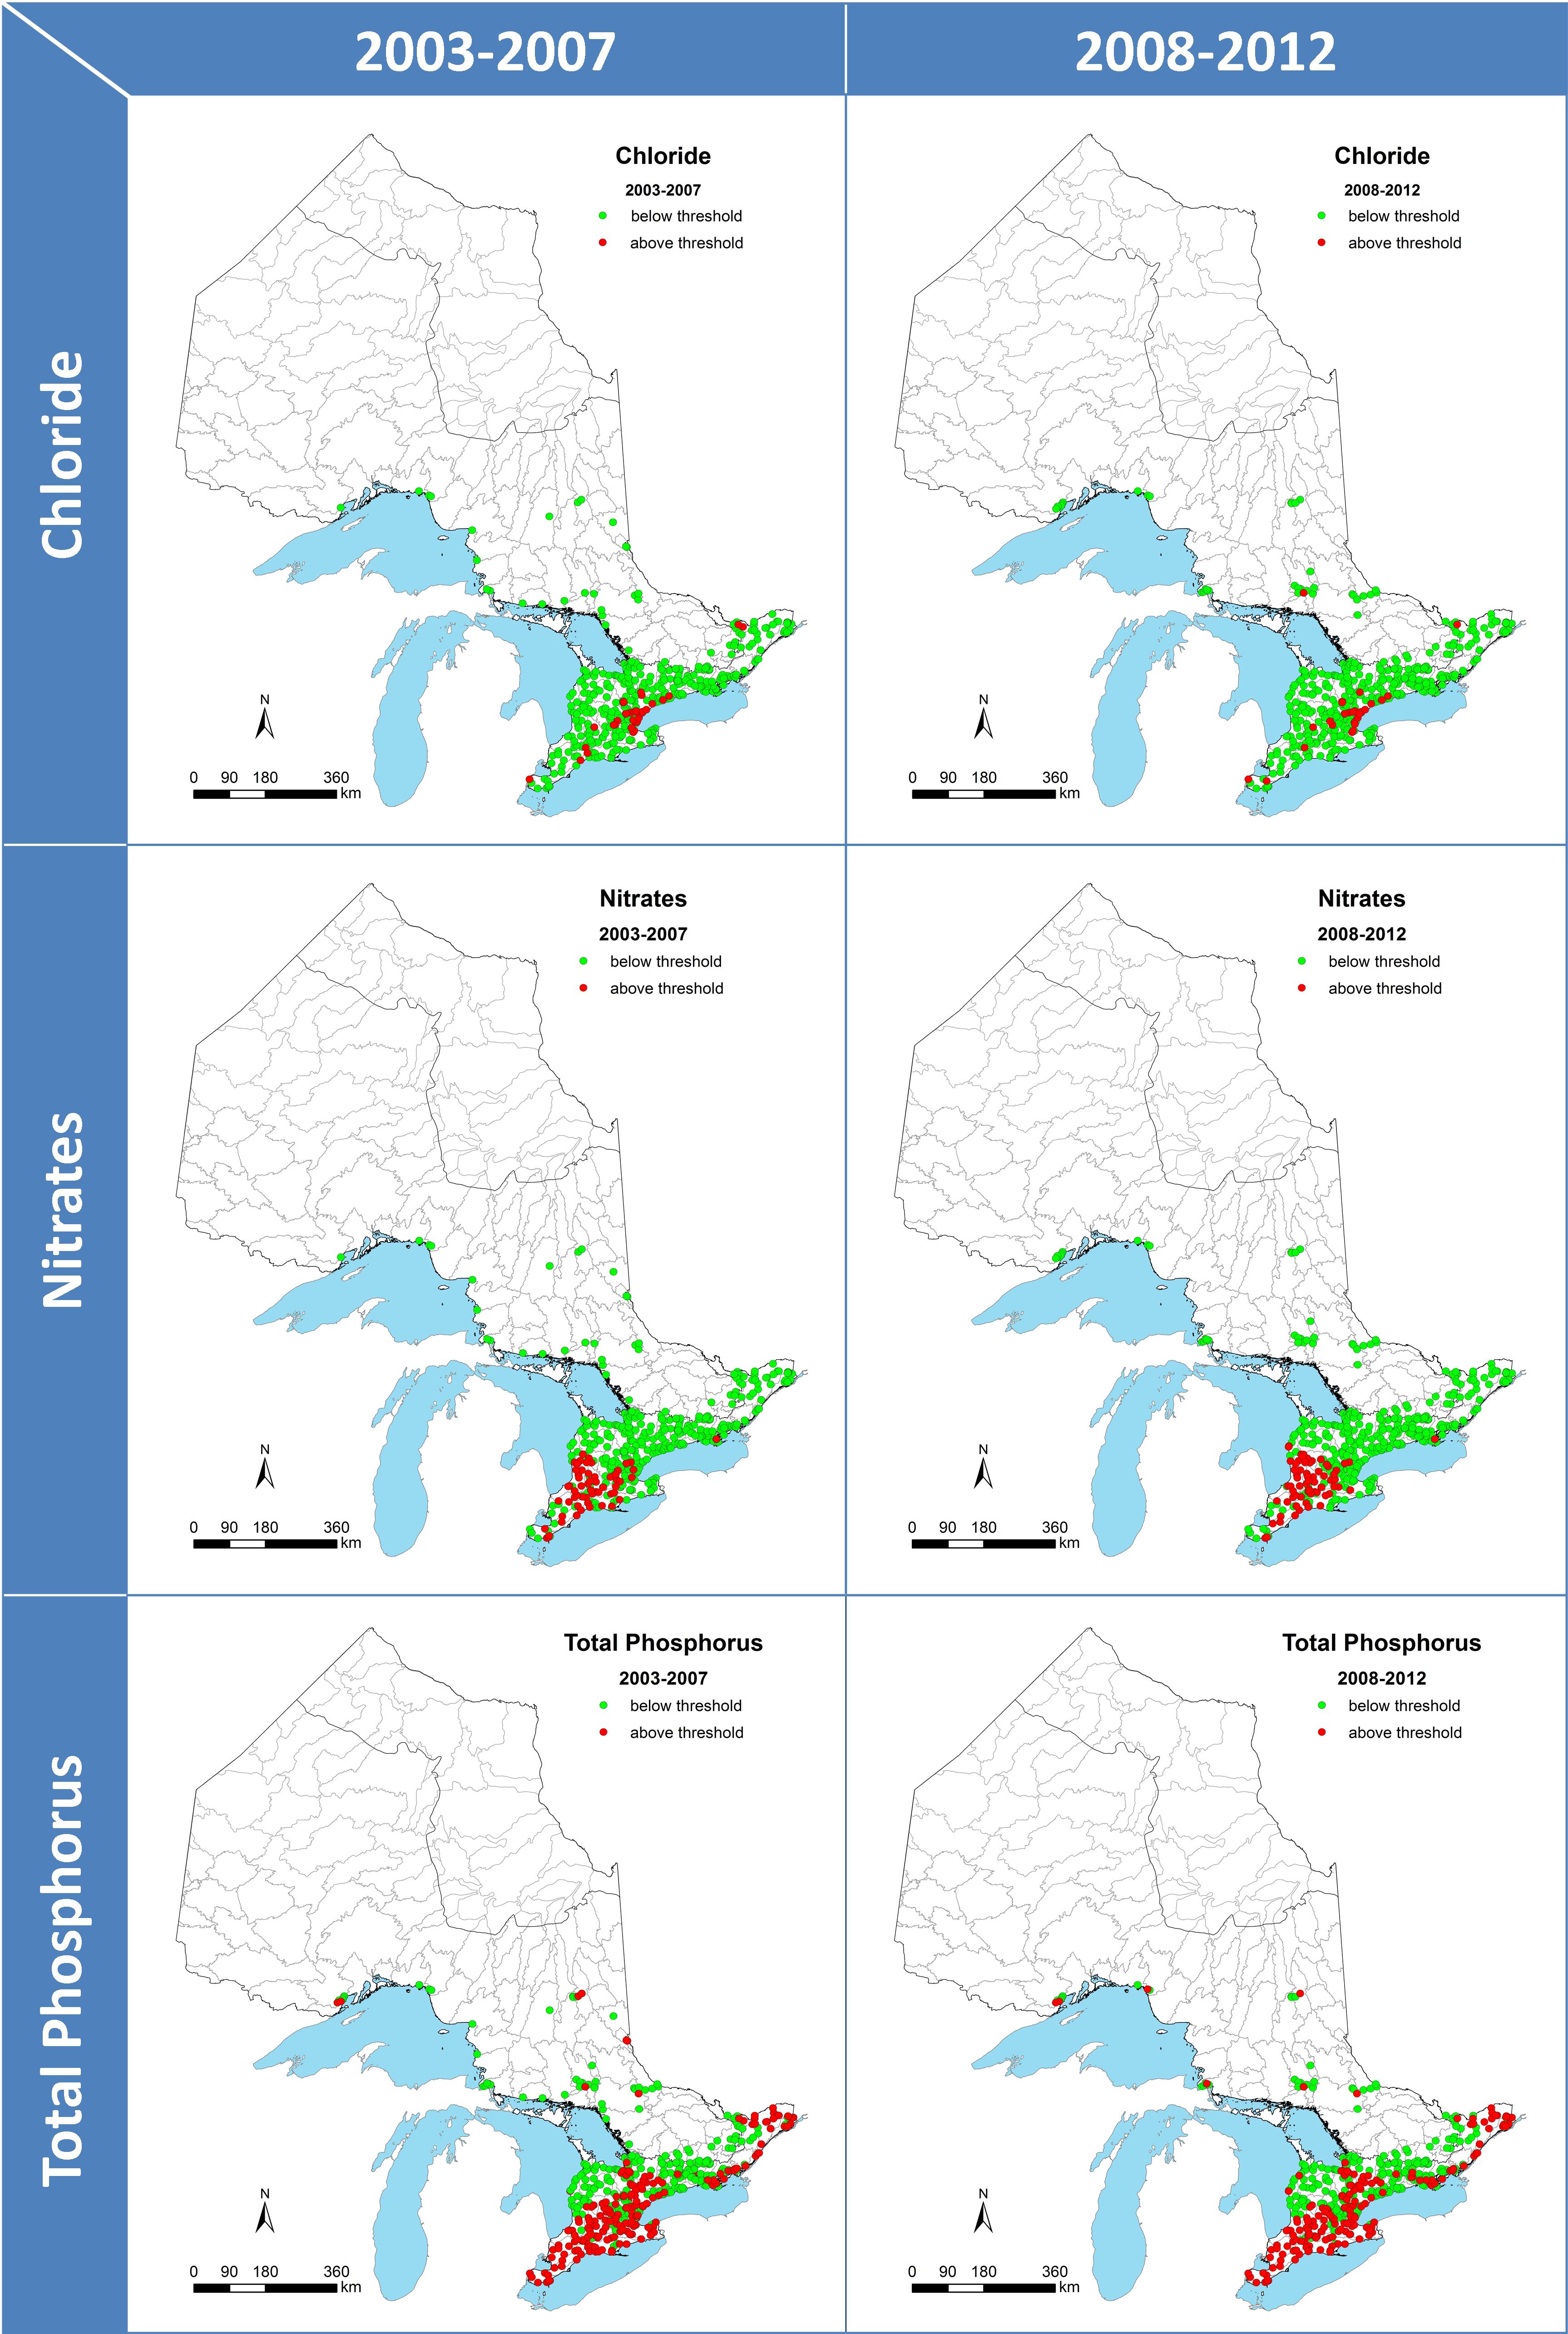
Figure 1. Status of median chloride, nitrate and total phosphorus levels against thresholds for supporting aquatic life for Ontario streams sampled during 2003-2007 (n = 404) and 2008-2012 (n = 431).
Figure 1. Status of median chloride, nitrate and total phosphorus levels against thresholds for supporting aquatic life for Ontario streams sampled during 2003-2007 (n = 404) and 2008-2012 (n = 431).
![Figure 2. Proportion of water quality stations above thresholds in each ecozone for Ontario streams sampled during 2008-2012 (n = 431) [numbers on chart are the number of stations in each category].](https://sobr.ca/wp-content/uploads/21-1_WQ-streams_new.jpg)
Figure 2. Proportion of water quality stations above thresholds in each ecozone for Ontario streams sampled during 2008-2012 (n = 431) [numbers on chart are the number of stations in each category].
Figure 2. Proportion of water quality stations above thresholds in each ecozone for Ontario streams sampled during 2008-2012 (n = 431) [numbers on chart are the number of stations in each category].

Figure 3. Proportion of water quality stations above thresholds for Ontario streams sampled during 2003-2007 and resampled during 2008-2012 (n = 361) [numbers on chart are the number of stations in each category].
Figure 3. Proportion of water quality stations above thresholds for Ontario streams sampled during 2003-2007 and resampled during 2008-2012 (n = 361) [numbers on chart are the number of stations in each category].
Status:
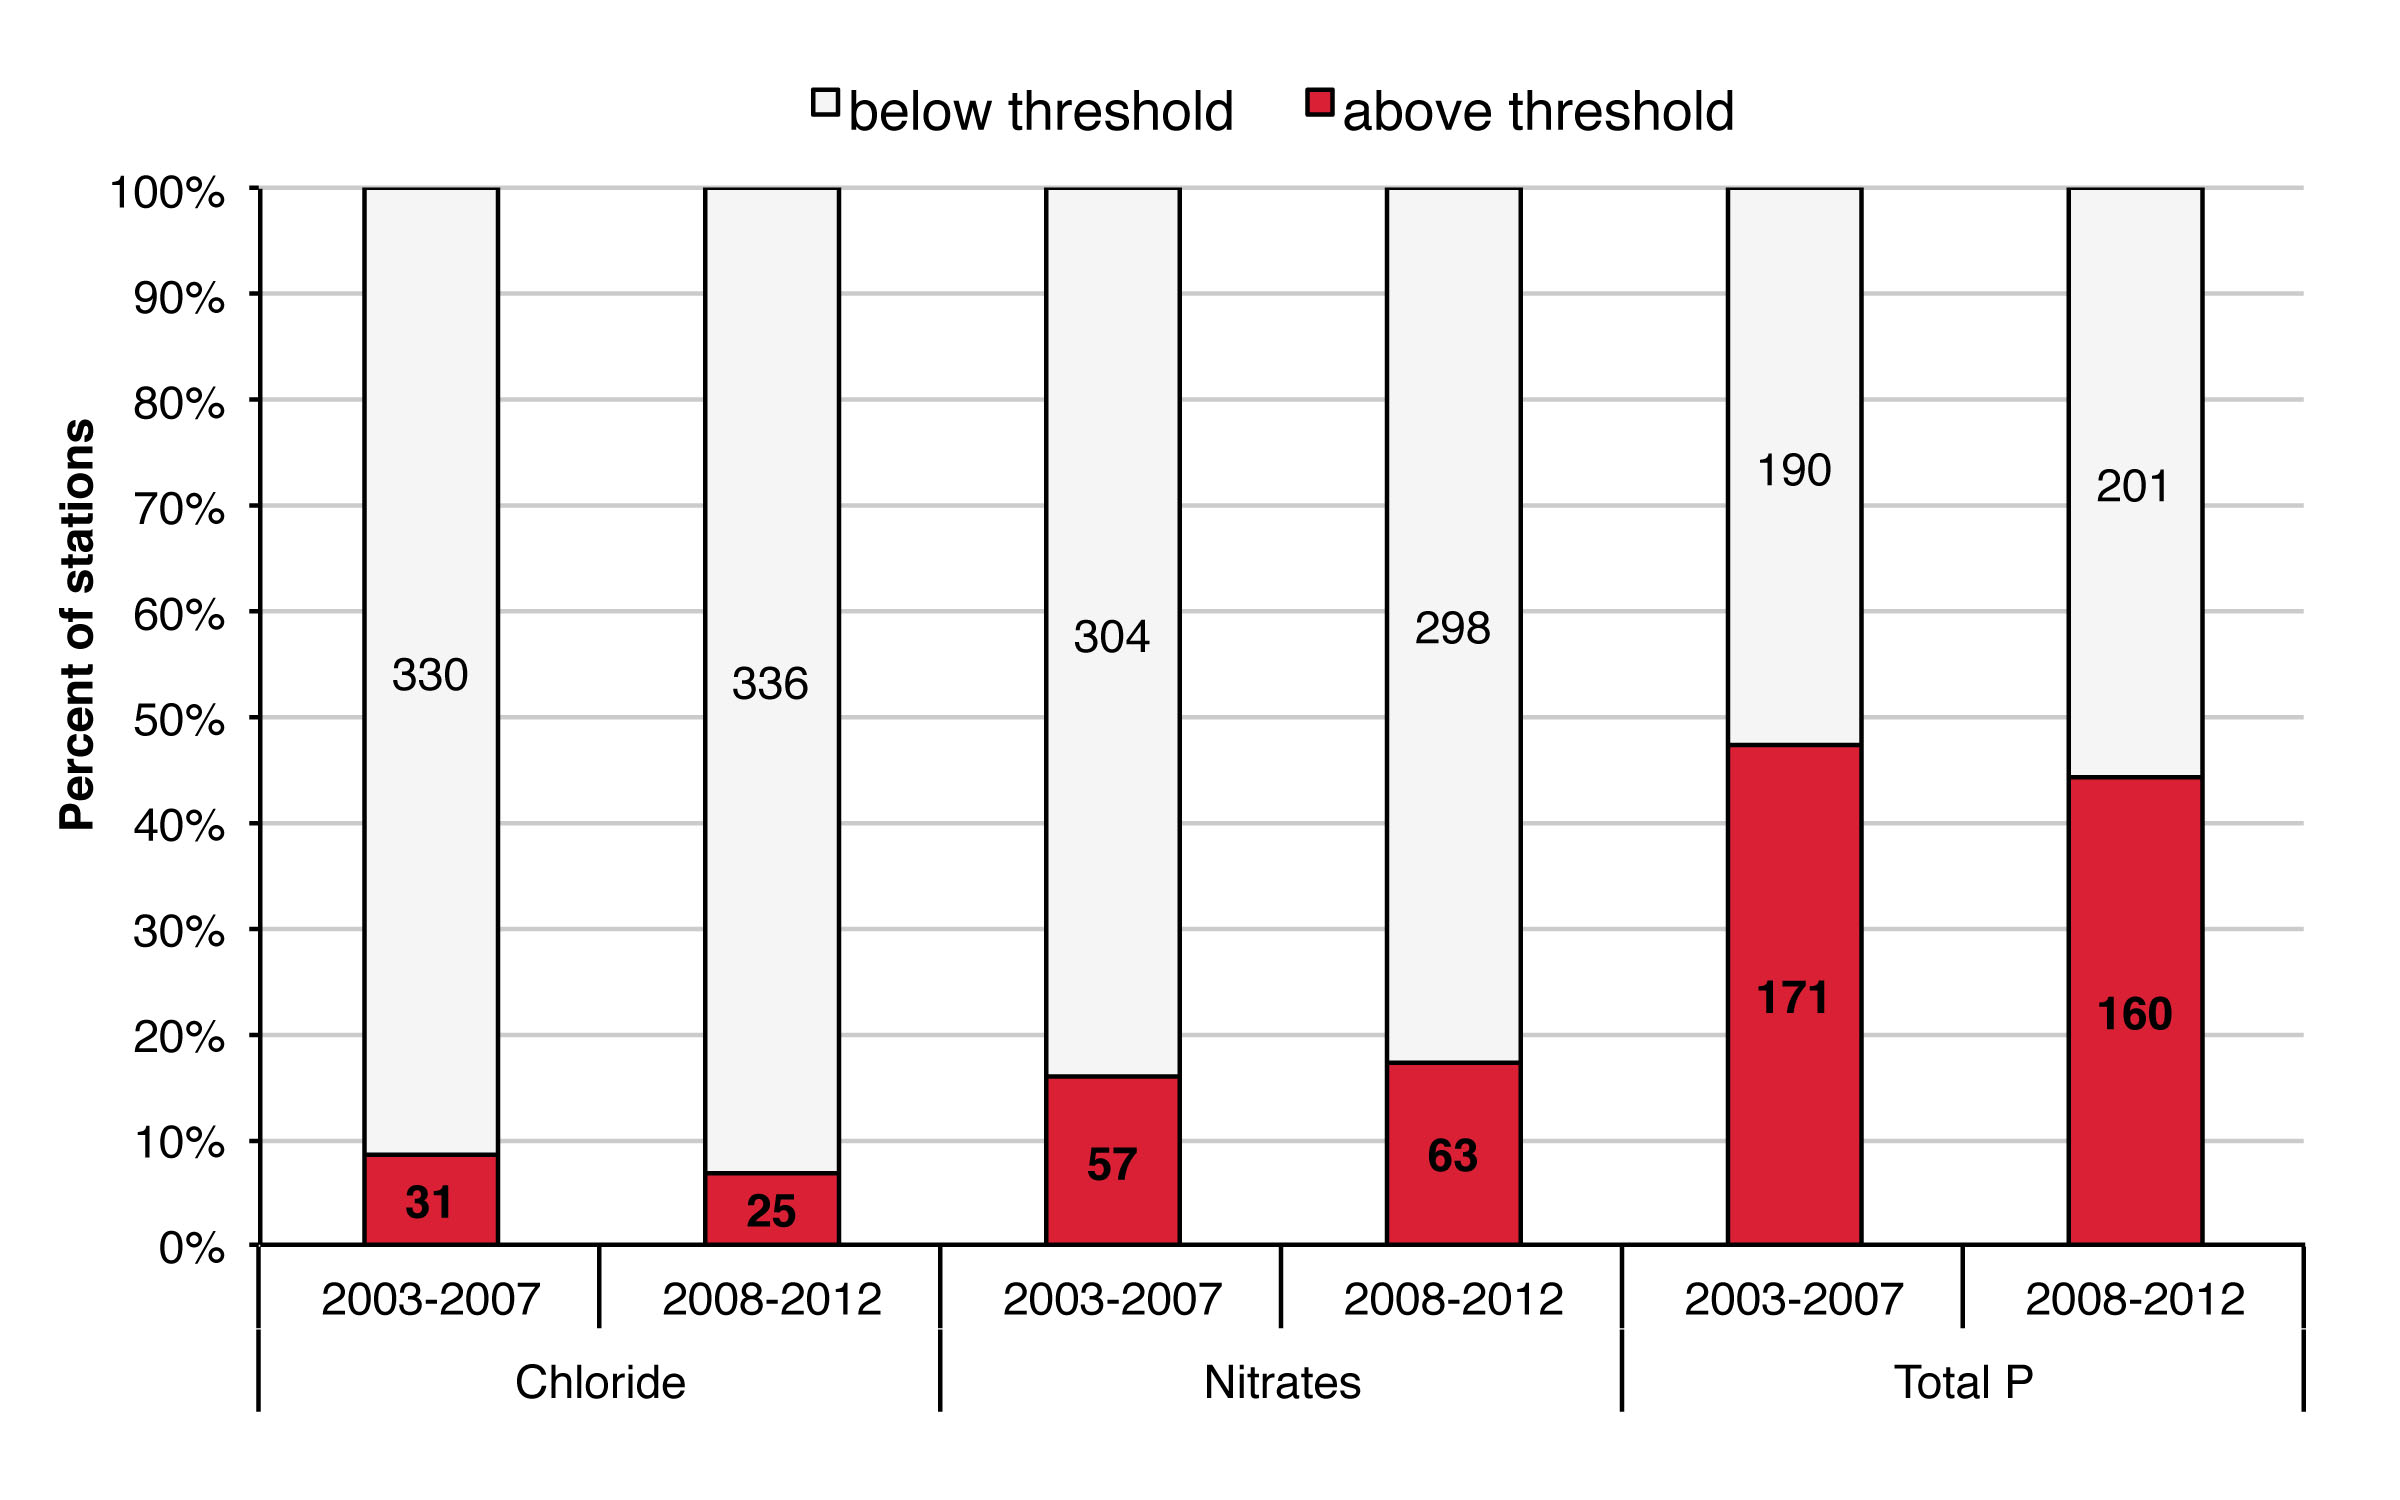
- Median chloride levels were below thresholds at more than 90% of stations during both time periods and there was a small decrease between time periods. Most stations with chloride levels above long-term exposure thresholds are in or adjacent to urban areas.
- Median nitrate levels were above thresholds at 15-16% of stations with a slight increase between time periods. Stations above threshold levels are concentrated in southwestern Ontario.
- Median total phosphorus levels were above thresholds at almost half of stations (42-47%) with a slight decrease between time periods. Stations with excessive phosphorus were distributed across the sampled area.
- Water quality at stations in the Ontario Shield Ecozone was consistently better than in the Mixedwood Plains Ecozone where urban and agricultural land use is more prevalent.
Stream water quality data from the Provincial Water Quality Monitoring Network (PWQMN) for two 5-year periods (2003-2007 and 2008-2012) were downloaded from Ontario’s Open Data Catalogue (see link below). Five-year median concentrations (middle values) of total chloride, total nitrates and total phosphorus were calculated for each station using results from samples collected between April and November. Samples collected between the months of December and March were excluded from the median calculations to ensure comparability among stations as only a portion of the stations have winter sampling. Median concentrations for stations with a minimum of 10 samples over the 5-year period were included in further analyses.
For each time period, stations were mapped showing whether median values were above or below thresholds for each water quality parameter (Figure 1). Stations with median values above the threshold value have levels higher than the threshold in at least half of the samples taken at the site. In addition to mapping all of the stations, the proportion of stations above threshold values was summarized by ecozone (Figure 2) and stations that were sampled in both time periods (n = 361) were compared to examine trends (Figure 3).
It is important to note that the PWQMN is designed to provide coverage in populated areas of Ontario, or areas where land uses may be affecting water quality. The network relies heavily on Conservation Authority partners for sample collection. The majority of stations are therefore found in the Mixedwood Plains Ecozone of southern Ontario.
• download PWQMN stream water quality data
Web Links:
Ontario Ministry of Environment and Climate Change – Provincial (Stream) Water Quality Monitoring Network – https://www.ontario.ca/environment-and-energy/provincial-stream-water-quality-monitoring-network-pwqmn-data
References:
Canadian Council of Ministers of the Environment (CCME). 2011. Canadian water quality guidelines for the protection of aquatic life: Chloride. In: Canadian environmental quality guidelines, Canadian Council of Ministers of the Environment, Winnipeg, MB. [Available at: http://ceqg-rcqe.ccme.ca/download/en/337/]
Canadian Council of Ministers of the Environment (CCME). 2012. Canadian water quality guidelines for the protection of aquatic life: Nitrate. In: Canadian environmental quality guidelines, Canadian Council of Ministers of the Environment, Winnipeg, MB. [Available at: http://ceqg-rcqe.ccme.ca/download/en/197/]
Environment Canada. 2008. Environment Canada. 2008. Canadian environmental sustainability indicators. Environment Canada Catalogue No.81-5/1-2008E. Environment Canada, Ottawa, ON.
Metcalfe, R.A., R.W. Mackereth, B. Grantham, N. Jones, R.S. Pyrce, T. Haxton, T., J.J. Luce, and R. Stainton. 2013. Aquatic ecosystem assessments for rivers. Aquatic Research Series 2013-06. Science and Research Branch, Ministry of Natural Resources, Peterborough, ON.
Ministry of Environment and Energy (MOEE). 1994. Water management policies, guidelines and provincial water quality objectives of the Ministry of Environment and Energy. Queen’s Printer for Ontario, Toronto, ON. [Available at: http://www.ontario.ca/environment-and-energy/water-management-policies-guidelines-provincial-water-quality-objectives]
Ontario Ministry of the Environment (OMOE). 2013. Water quality in Ontario 2012 report. Queen’s Printer for Ontario, Toronto, ON. [Available at: https://www.ontario.ca/environment-and-energy/water-quality-ontario-report-2012]

![Figure 2. Proportion of water quality stations above thresholds in each ecozone for Ontario streams sampled during 2008-2012 (n = 431) [numbers on chart are the number of stations in each category].](https://sobr.ca/wp-content/uploads/21-1_WQ-streams_new.jpg)

