
Indicator
Out of an initial list of 67 species, 50 had data to calculate genetic indicators for at least one population. These 50 species spanned eight taxonomic groups—amphibians, reptiles, birds, mammals, fish, insects, molluscs, and plants (Table 1). Birds and mammals were the best represented, each with 12 species included in the final dataset. Insects were least represented, with only two species with enough data to calculate indicators. Final assessments included 15 species listed as endangered by COSSARO, 17 listed as threatened, 12 listed as special concern, and six not at risk. In total 115 populations were assessed (Table 1).
Table 1: Summary of species, populations, and mean Ne>500 indicator values across taxonomic groups in Ontario. The table presents the number of species and populations assessed for each taxonomic group, along with the mean Ne>500 indicator value for each taxon with standard deviation. The Ne>500 indicator reflects the proportion of populations within species with an effective population size exceeding 500, averaged over taxonomic groups. Note: range is 0-1 with 1 indicating the ideal state.
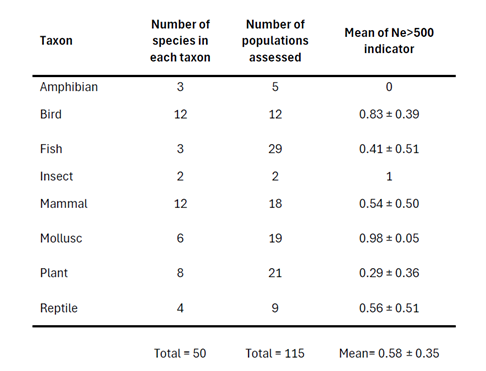
Census data constituted most of the population size information used to estimate Ne. Of the 50 species assessed, only 12 (24%) had genetic estimates of effective population size for at least one population. For the remaining 38 (76%) species, census population size (Nc) was used to estimate proxies of Ne. In cases where populations had both census and genetic estimates available, estimates tended to agree with each other except in one population in the eastern foxsnake (Pantherophis vulpinus), where genetic estimates of Ne exceeded those extrapolated from census size.
Across all 115 assessed populations, 64 (56%) had estimated effective population sizes below 500, indicating that most assessed populations are not large enough to maintain genetic diversity. At the species-level, the distribution of the Ne>500 indicator was bimodal, with most species either having a value of 0 (i.e. all populations within the species had effective population sizes under 500, n=15, 30%) or 1 (i.e. all populations within the species had effective population sizes over 500, n=27, 54%), with few in between (Figure 1).
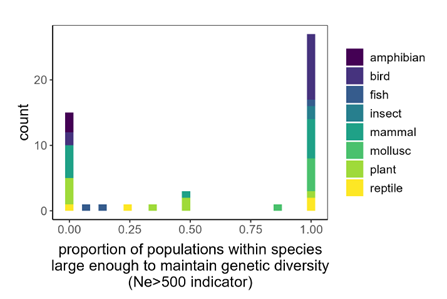
Figure 1. Distribution of species-level Ne>500 genetic diversity indicators. The Ne>500 indicator describes the proportion of populations within a species that exceeds an effective population size of 500. Each bar is color-coded to indicate taxonomic groups.
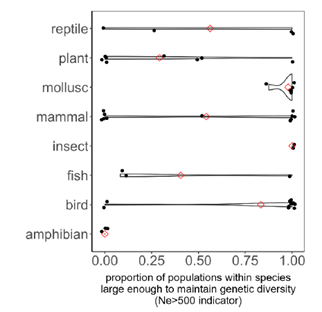
Figure 2. Violin plots showing the distribution of species-level Ne>500 genetic diversity indicators across taxonomic groups. Red diamonds show mean Ne>500 per taxonomic group.
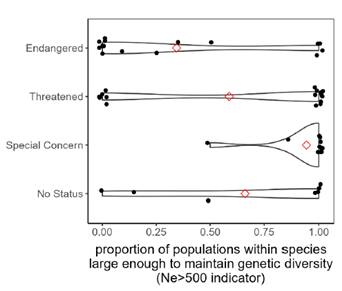
Figure 3. Violin plots showing the distribution of species-level Ne>500 genetic diversity indicators for species with different conservation statuses according to the Committee on the Status of Species at Risk in Ontario (COSSARO). Species assessed by COSSARO as ‘not at risk’ were lumped with species that have not been assessed in the ‘no status’ category.
Status
- Out of an initial list of 67 species, 50 species across eight taxonomic groups had data to calculate genetic indicators for at least one population. Birds and mammals were the best represented, each with 12 species included in the final dataset. Insects were least represented, with only two species with enough data to calculate genetic indicators.
- Of the 50 species assessed, 15 are listed as endangered by COSSARO, 17 listed as threatened, 12 listed as special concern, and six were not at risk. In total 115 populations were assessed (Table 1).
- Across all 115 assessed populations, 64 (56%) had estimated effective population sizes below 500, indicating that most assessed populations are not large enough to maintain genetic diversity.
- At the species-level, the distribution of the Ne>500 indicator showed that 30% (n=15) had a value of 0 (i.e. all populations within the species had effective population sizes under 500) and 54% (n=27) had a value of 1 (i.e. all populations within the species had effective population sizes over 500), with (8?) species falling between 0 and 1 (Figure 1).
- Endangered species had on average the lowest Ne>500 indicator values, while species of special concern had the highest (Figure 3). The mean Ne>500 indicator for Ontario (i.e. the average of taxon-averaged indicators) is 0.58 with a standard deviation of 0.35 (Table 1).
- There are limitations to this approach (as identified in the technical report). Efforts will continue to increase the number of species included in the indicator and to address some of the limitations for 2030.
Last Updated: May 16, 2025