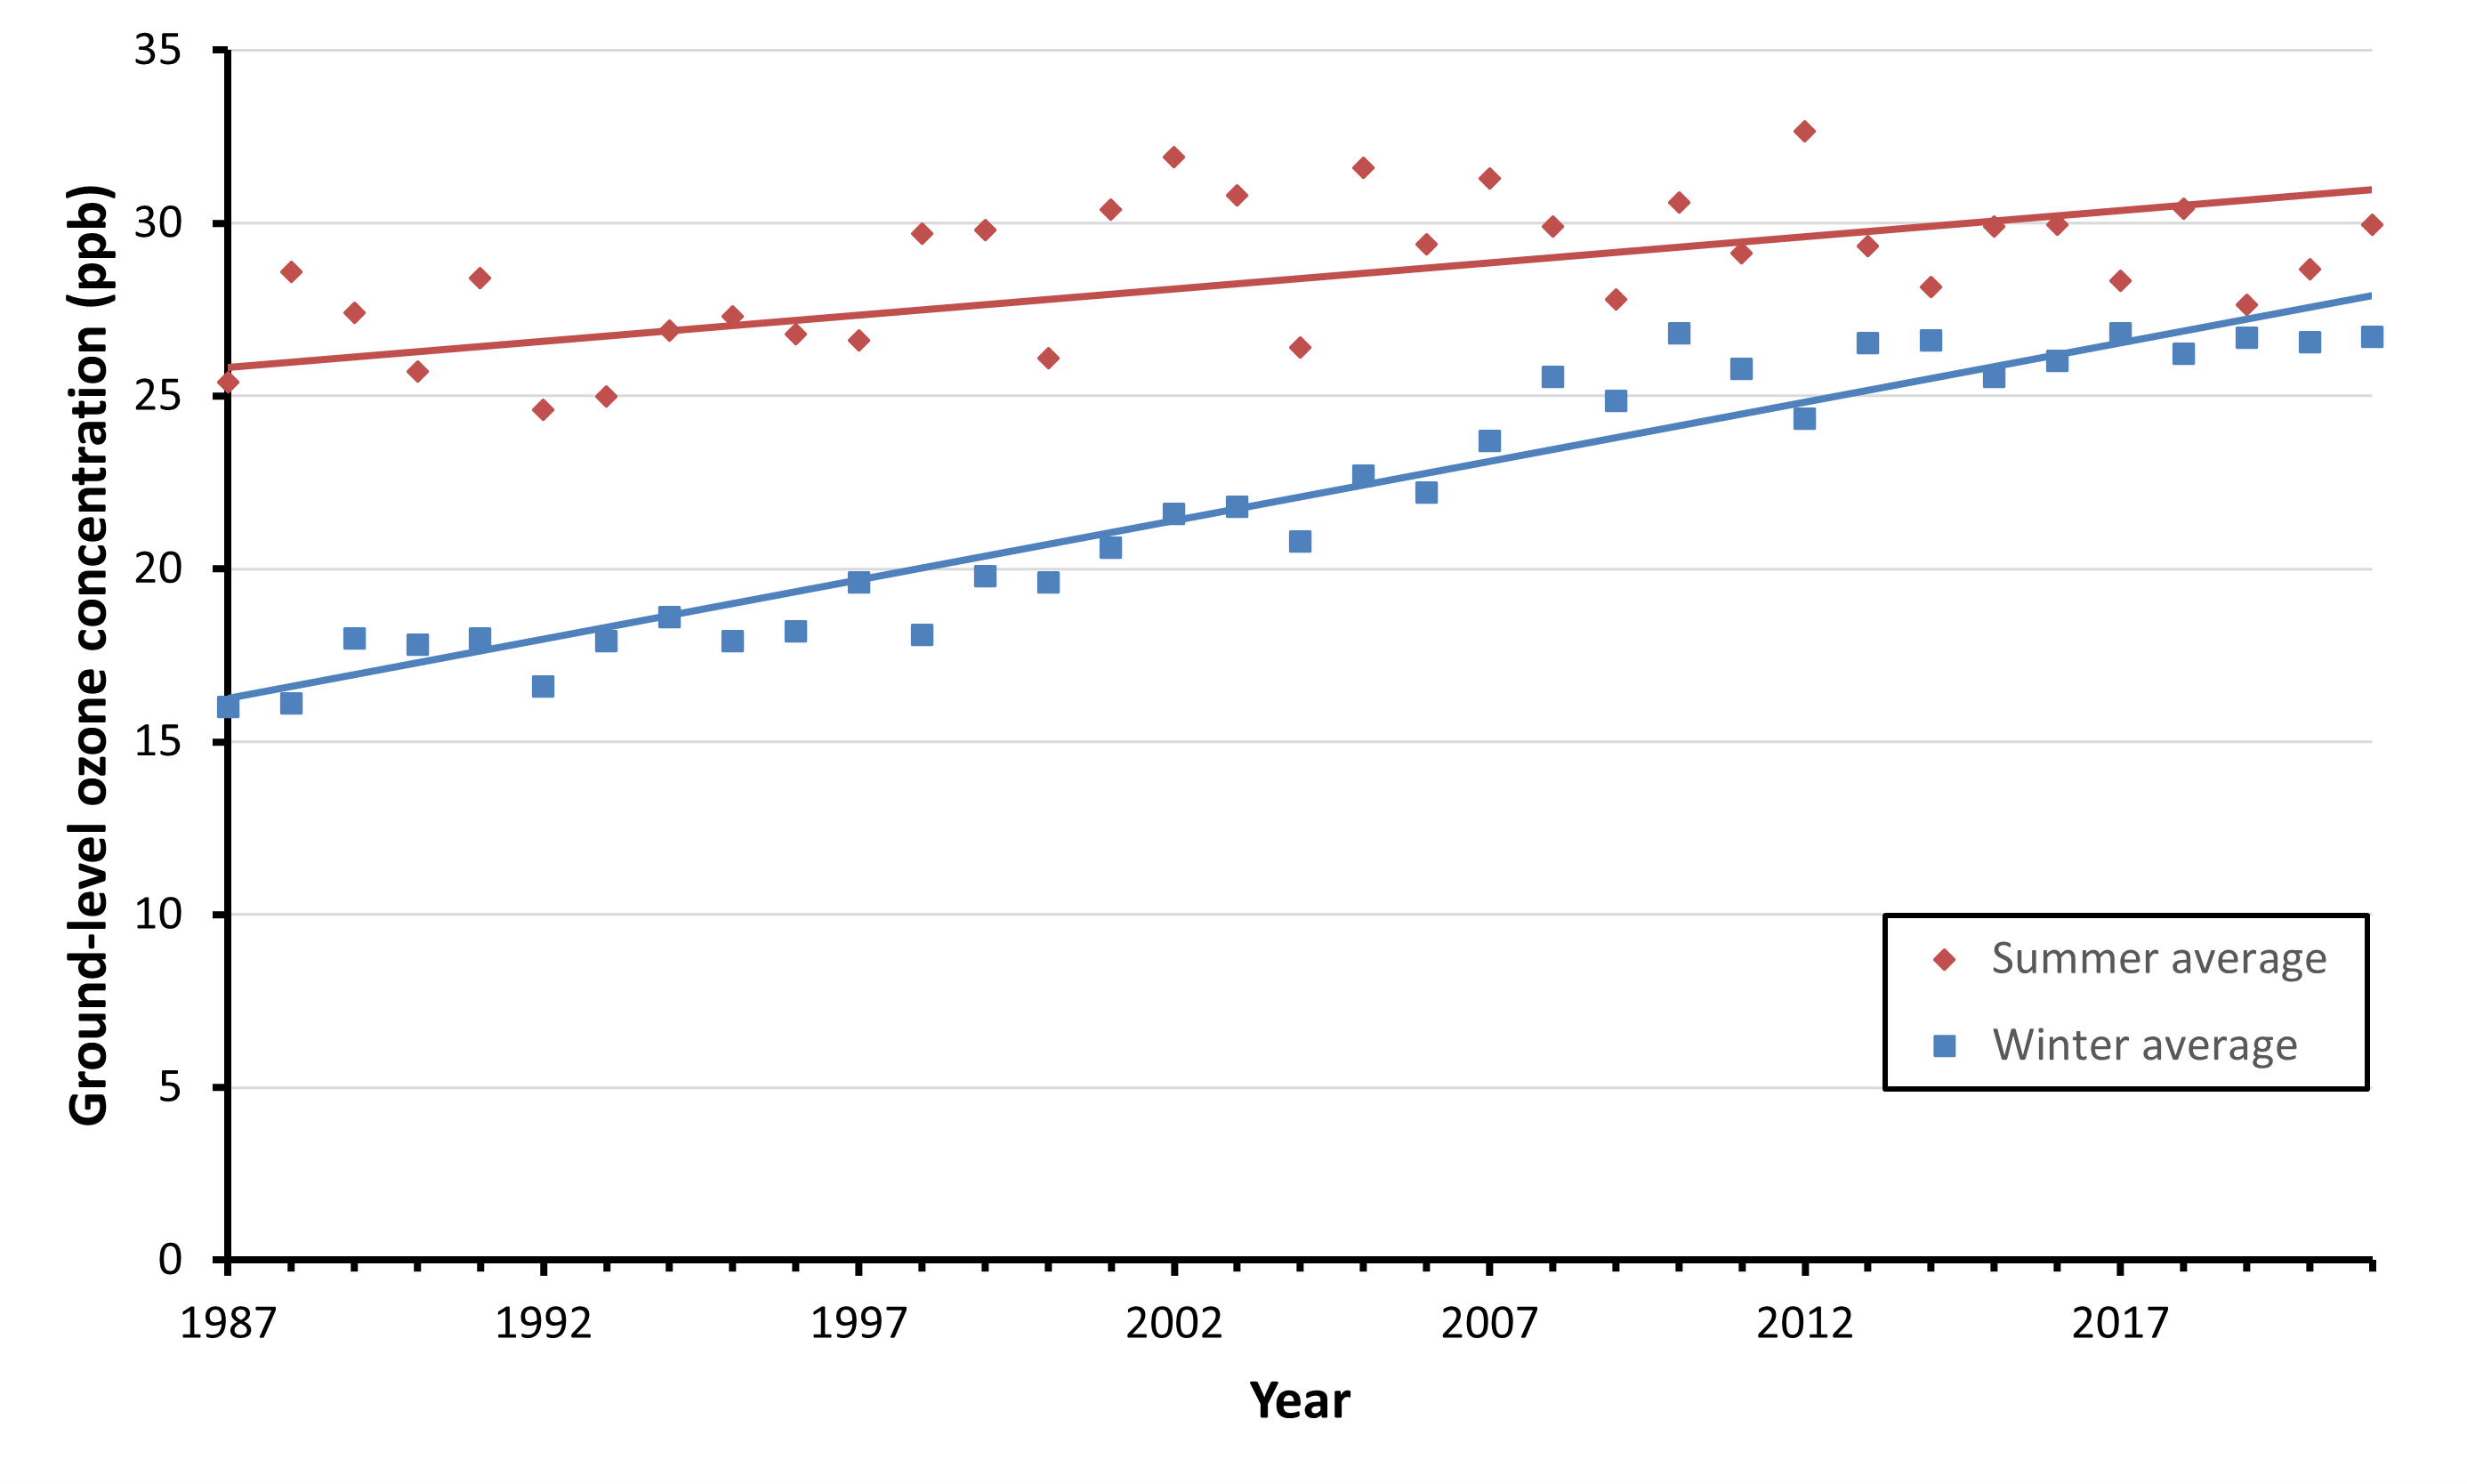
Figure 1. Seasonal means and 30-year trendlines of ground-level ozone at monitoring sites across Ontario for the period 1987-2021 Summer mean is calculated May-September, winter means is calculated between January-April, October-December) (Source: OMOECC 2008 and OMECP 2021).

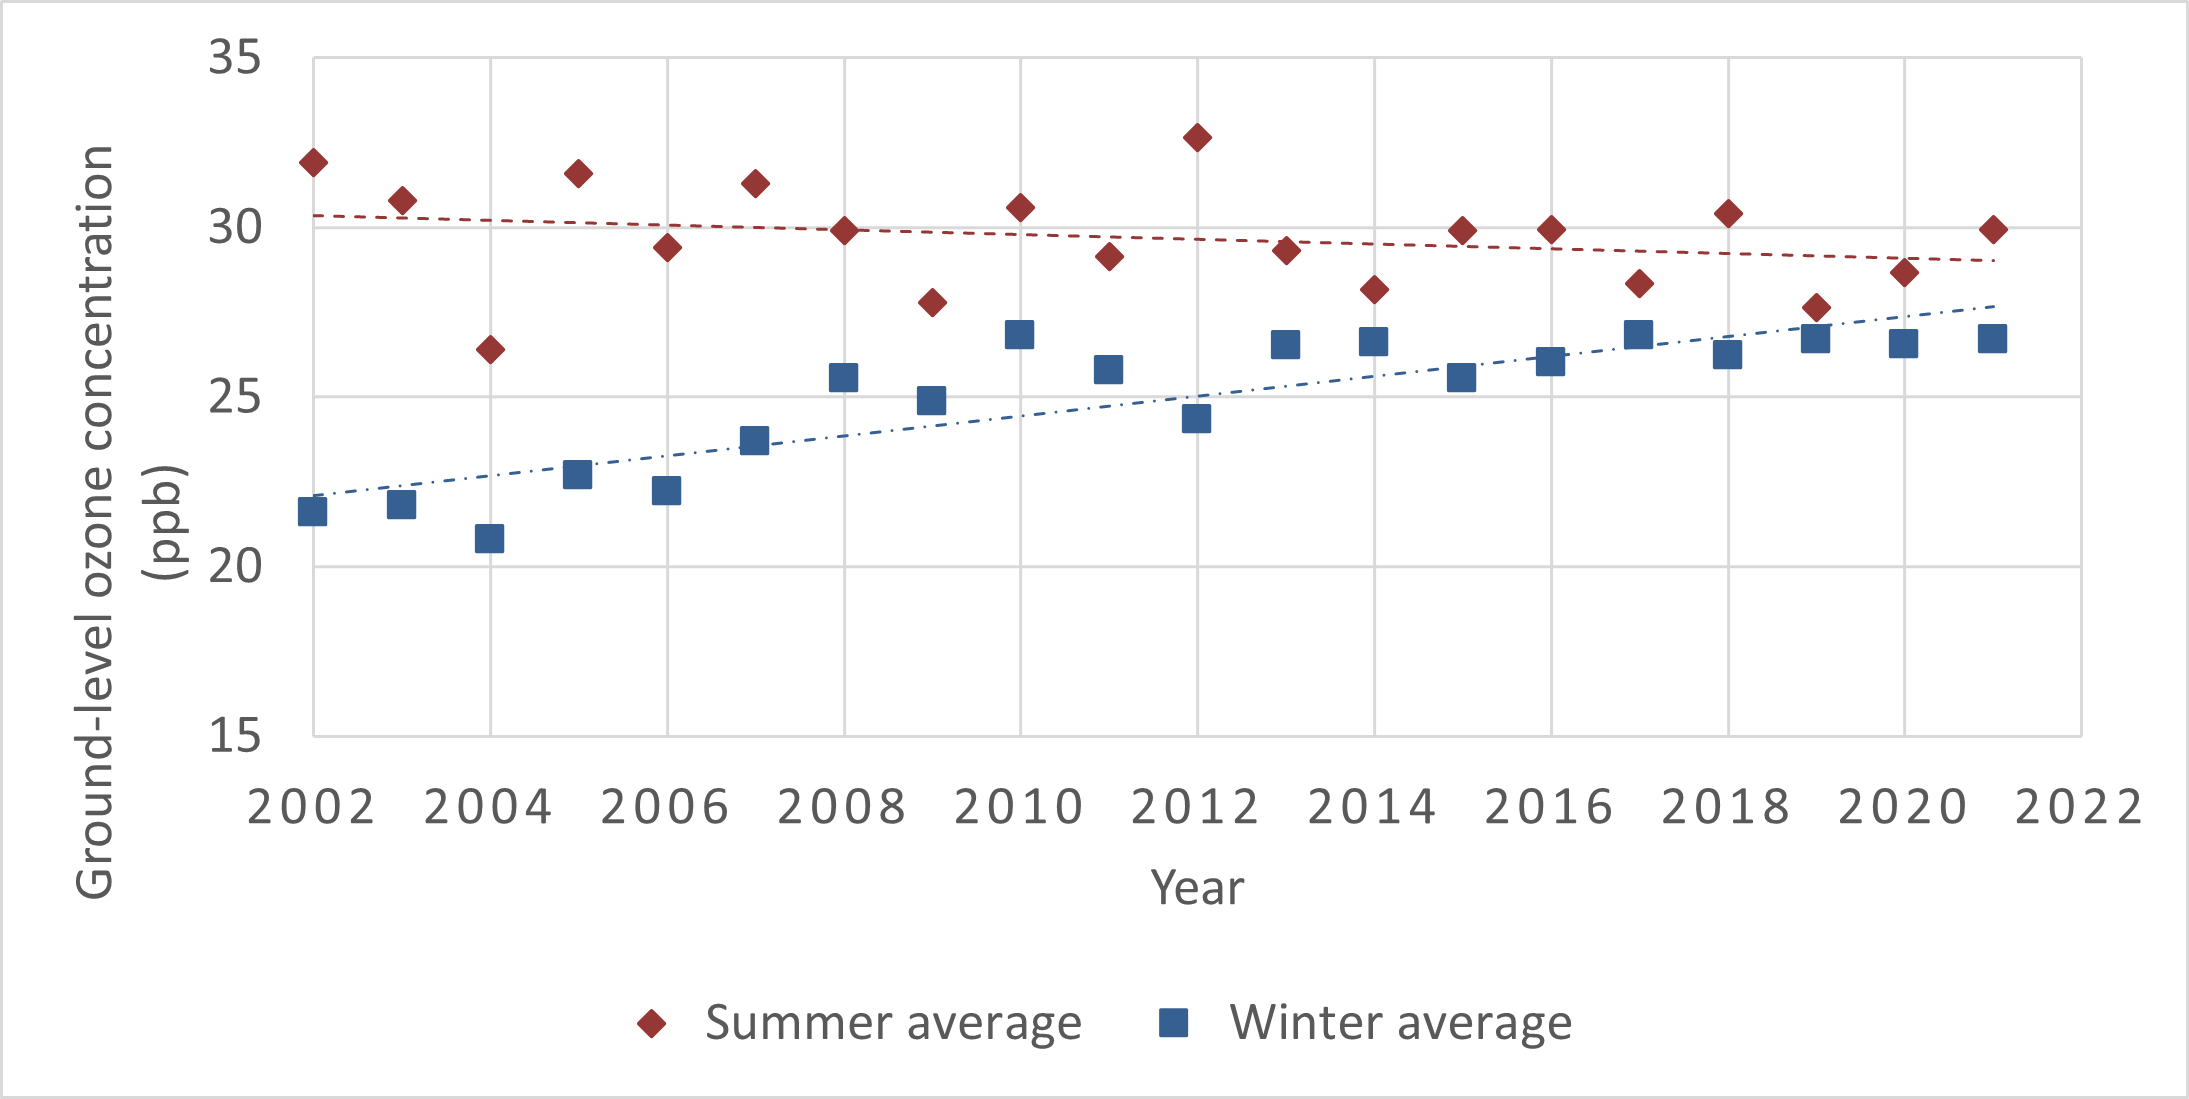
Figure 2. Seasonal means of ground-level ozone at monitoring sites across Ontario for the period of 2002 – 2021 Summer mean is calculated May-September, winter means is calculated between January- April, October-December) (Source: OMOECC 2008 and OMECP 2021).

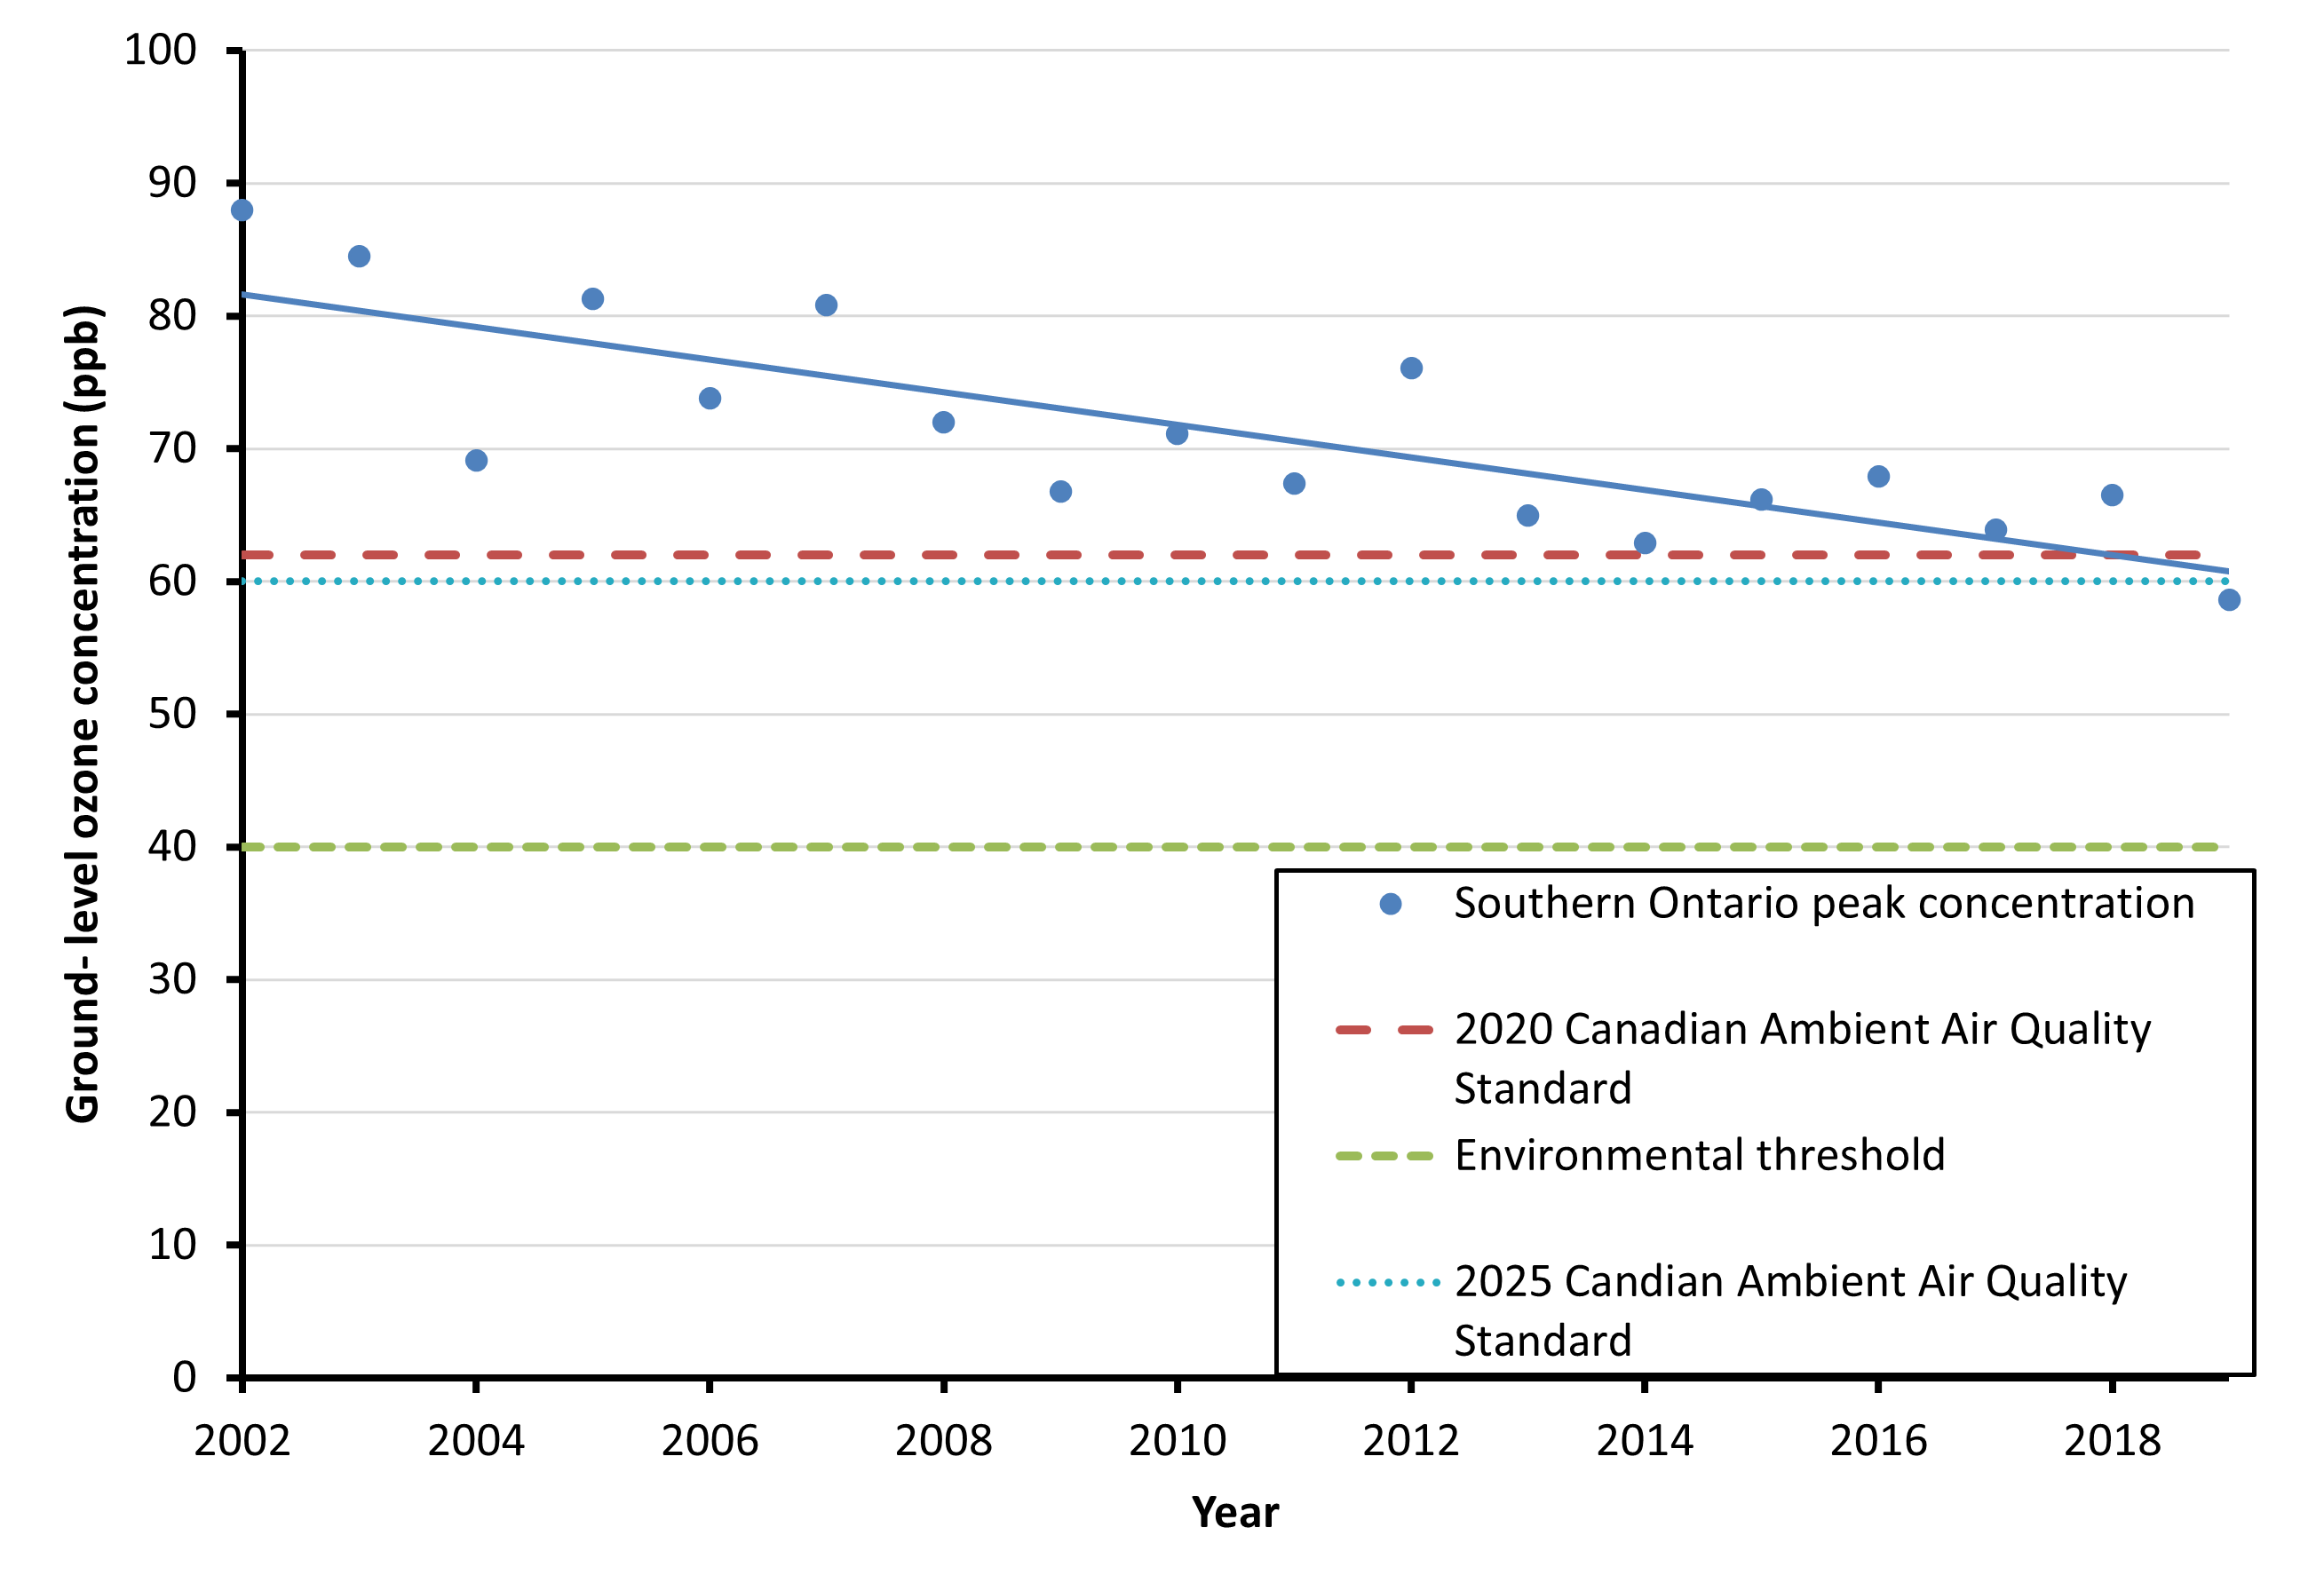
Figure 3. Annual peak (fourth-highest) daily maximum 8-hour average ground-level ozone concentration at sites across southern Ontario 2002-2019 (n = 38) (Source: Environment and Climate Change Canada 2019) (Note: The red widely spaced horizontal dashed line represents the value of the Canadian Ambient Air Quality Standards (CAAQS) for 2020 and the light blue dotted line represents the CAAQS for 2025 is shown for indicative purposes only, and not for evaluation of the achievement status of the standard. The green more closely spaced horizontal dashed line represents the environmental threshold above which impacts are likely on vegetation (Royal Society 2008).
Status:
- Between 1987 and 2021, there was an increasing trend in seasonal means of ground-level ozone in Ontario, with summer average concentrations consistently higher than winter average concentrations. Over the 30-year period, average summer concentrations increased by approximately 12% while average winter concentrations increased by nearly 68%. Average winter ground-level ozone concentrations in Ontario are increasing at a faster rate, approximately 0.34 ppb/year, compared to average summer ground-level ozone concentrations which are increasing at approximately 0.15 ppb/year. The increase in winter ozone averages can be largely attributed to rising global background concentrations.
- From 2002, the second highest year, to 2021 summer average concentrations decreased slightly, while winter averages have continued to increase. In 2012, the summer highest concentration of ground-level ozone was recorded at 32.6, while winters highest concentration were 2010 and 2017 both recorded at 26.8 ppb.
- In 2021, Port Stanley had the highest summer ground-level ozone concentrations (34.3 ppb) of all the stations and Sudbury had the lowest (23.4), while Tiverton had the highest concentrations in the winter (32 ppb) and Toronto North had the lowest (23.8 ppb).
- A decreasing trend was detected in the annual peak concentrations of ground-level ozone from 2002 to 2019, representing a decrease of 34% (or an average of 1.9% per year) over that period. A reduction in emissions of ground-level ozone precursor gases (nitrogen oxides and volatile organic carbons) from Canada and the United States is likely an important factor in this downward trend. The annual peak ground-level ozone concentrations were above both the 2020 Canadian Ambient Air Quality Standard and the environmental threshold for all years except the year 2019 which fell below the 2020 Canadian Ambient Air Quality Standard.
Seasonal means of ground level ozone concentrations were assessed to compare concentrations in winter (January to April and October to December) vs summer (May-September) over time. Ground-level ozone forms in greater quantities in the summer due to hot, sunny, calm days. Comparing the concentrations in summer and winter means over time can give us an idea of whether concentrations are increasing or decreasing. Data to assess trends in the seasonal means of ground-level ozone concentrations in Ontario from 1987-2021 (Fig. 1) and for 2002-2021 (Fig. 2) were obtained from the Air Quality in Ontario Reports (OMOE 2008; OMECP 2021). Seasonal means were based on data from ozone monitoring stations operated across Ontario. A 75% data completeness criterion was used to derive trends. Long-term trends in ground-level ozone were derived using data from monitoring stations across Ontario [19 stations for the period 1987 to 2007 (OMOE 2008), 39 stations for the years 2008 to 2017 (OMECP 2019), and 38 stations for the years 2018-2021 (OMECP 2021)]. Stations are dispersed across the province, though most are concentrated in metropolitan areas in southern Ontario. The summer and winter annual means for each station were averaged order to get an overall annual provincial mean for both summer and winter concentrations.
Data used to assess annual peaks (fourth-highest) for daily maximum 8-hour average ground-level ozone concentrations from 2002 to 2019 (Fig. 3) were obtained from the Canadian Environmental Sustainability Indicators Air Quality Report 2019 (Environment and Climate Change Canada 2019) which includes data from the National Air Pollution Surveillance Program (NAPS) and the Canadian Air and Precipitation Monitoring Network (CAPMoN). The annual peaks for ground-level ozone are calculated using an approach that is aligned with the Canadian Ambient Air Quality Standards (CAAQS). Annual peaks for Ontario are based on data collected from 38 monitoring stations in southern Ontario. Peaks are based on the fourth-highest of the daily maximum 8-hour average concentrations measured over a given year (using the 4th highest allows for more regulatory stability as some days/years will have higher ozone concentrations). Canadian ambient air quality standards for ozone are set at 62 ppb for 2020 and 60 ppb for 2025.
Related Theme(s)
Related Target(s)
Web Links:
Canadian Environmental Indicators http://www.ec.gc.ca/indicateurs-indicators/default.asp?lang=En
Ontario Ministry of Environment, Conservation and Parks Air Quality Reports http://www.airqualityontario.com/press/publications.php
National Air Pollution Surveillance Program (NAPS) https://www.canada.ca/en/environment-climate-change/services/air-pollution/monitoring-networks-data/national-air-pollution-program.htmlhttp://www.ec.gc.ca/rnspa-naps/
Canadian Air and Precipitation Monitoring Network (CAPMoN) https://www.ec.gc.ca/rs-mn/default.asp?lang=En&n=752CE271-1
Iowa department of Natural Resources https://www.iowadnr.gov/Environmental-Protection/Air-Quality/Air-Pollutants/Effects-Ozone#:~:text=Elevated%20levels%20of%20ozone%20leads,stresses%20such%20as%20harsh%20weather
References:
Environment and Climate Change Canada (2019) Canadian Environmental Sustainability Indicators: Air quality. [Available at: https://www.canada.ca/en/environment-climate-change/services/environmental-indicators/air-quality.html].
Hayes F., M.L.M. Jones, G. Mills, and M. Ashmore. 2007. Meta-analysis of the relative sensitivity of semi-natural vegetation species to ozone. Environmental Pollution 146:754-762.
Lovett, G.M., T.H. Tear, D.C. Evers, S.E.G. Findlay, B.J. Cosby, J.K. Dunscomb, C.T. Driscoll, and K.C. Weathers. 2009. Effects of air pollution on ecosystems and biological diversity in the eastern United States. BioScience 1162:99-135.
Ministry of Environment, Conservation and Parks (MECP). 2021. Air Quality in Ontario 2021 Report. [Available at: https://www.ontario.ca/document/air-quality-ontario-2021-report].
Ontario Ministry of the Environment (OMOE). 2008. Air Quality in Ontario Report 2007. Queen’s Printer for Ontario, Toronto, ON.
Royal Society. 2008. Ground-level ozone in the 21st century: future trends, impacts and policy implications. Science Report, Royal Society, London.
Wittig V.E, E.A. Ainsworth, S.L. Naidu, D.F. Karnosky and S.P. Long. 2009. Quantifying the impact of current and future tropospheric ozone on tree biomass, growth, physiology and biochemistry: a quantitative meta-analysis. Global Change Biology 15:396-424.


