
Figure 1. Effective mesh or habitat patch size by ecodistrict across Ontario 2020 (OLC v.1 2025).Note: Agricultural lands are not measured as a barrier using this model which can make southwestern Ontario (specifically ecodistrict 7E-1) look less fragmented than it is.
2011
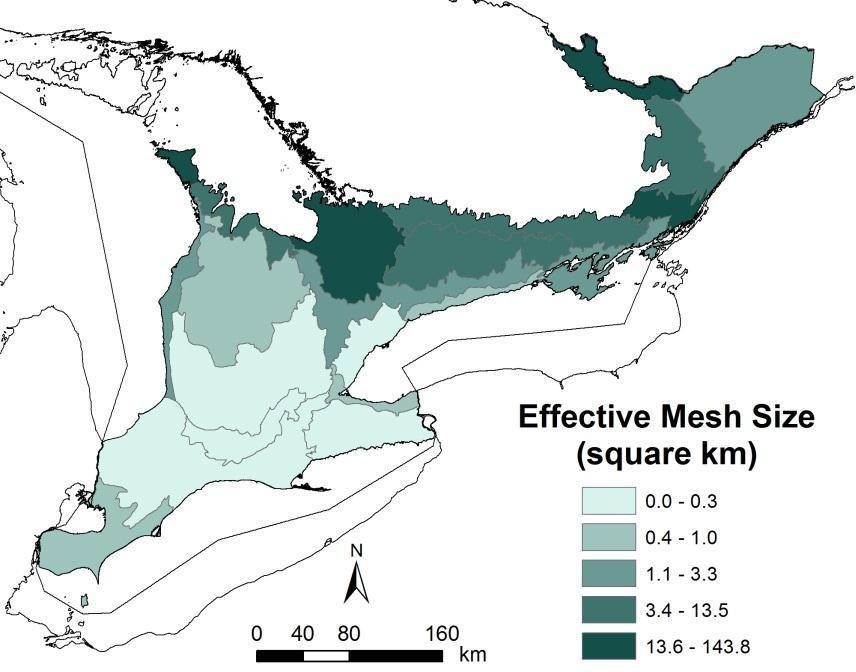
Figure 2. Effective Mesh or habitat patch size for ecodistricts in southern Ontario 2011. The larger the area in km² the less fragmentation in the area. Manitoulin island is excluded as it does not fall within the SOLRIS boundary (SOLRIS v2.0, 2015). *please note changes to effective mesh size can be attributed to real increase/decreases and improved data methodology, Agricultural lands are not measured as a barrier using this model which can make southwestern Ontario (specifically ecodistrict 7E-1) look less fragmented than it is.
2015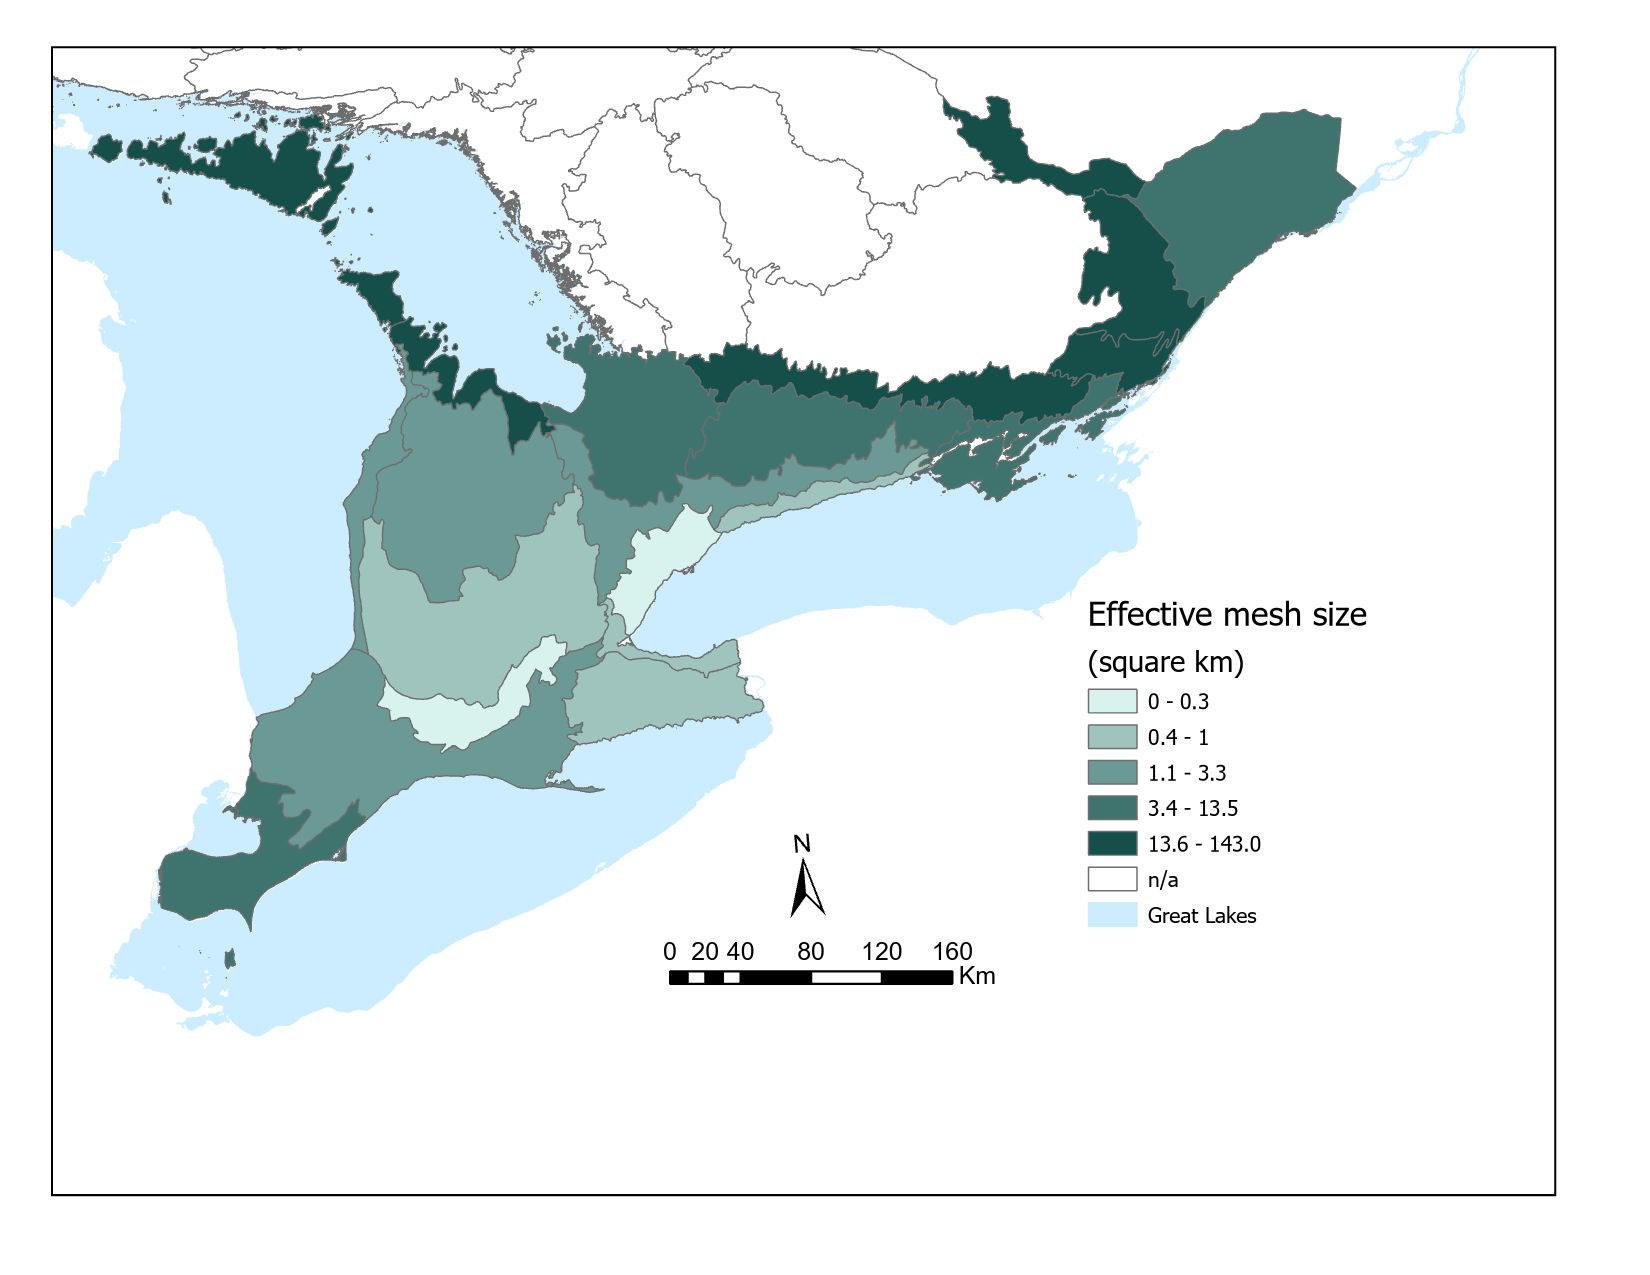
2020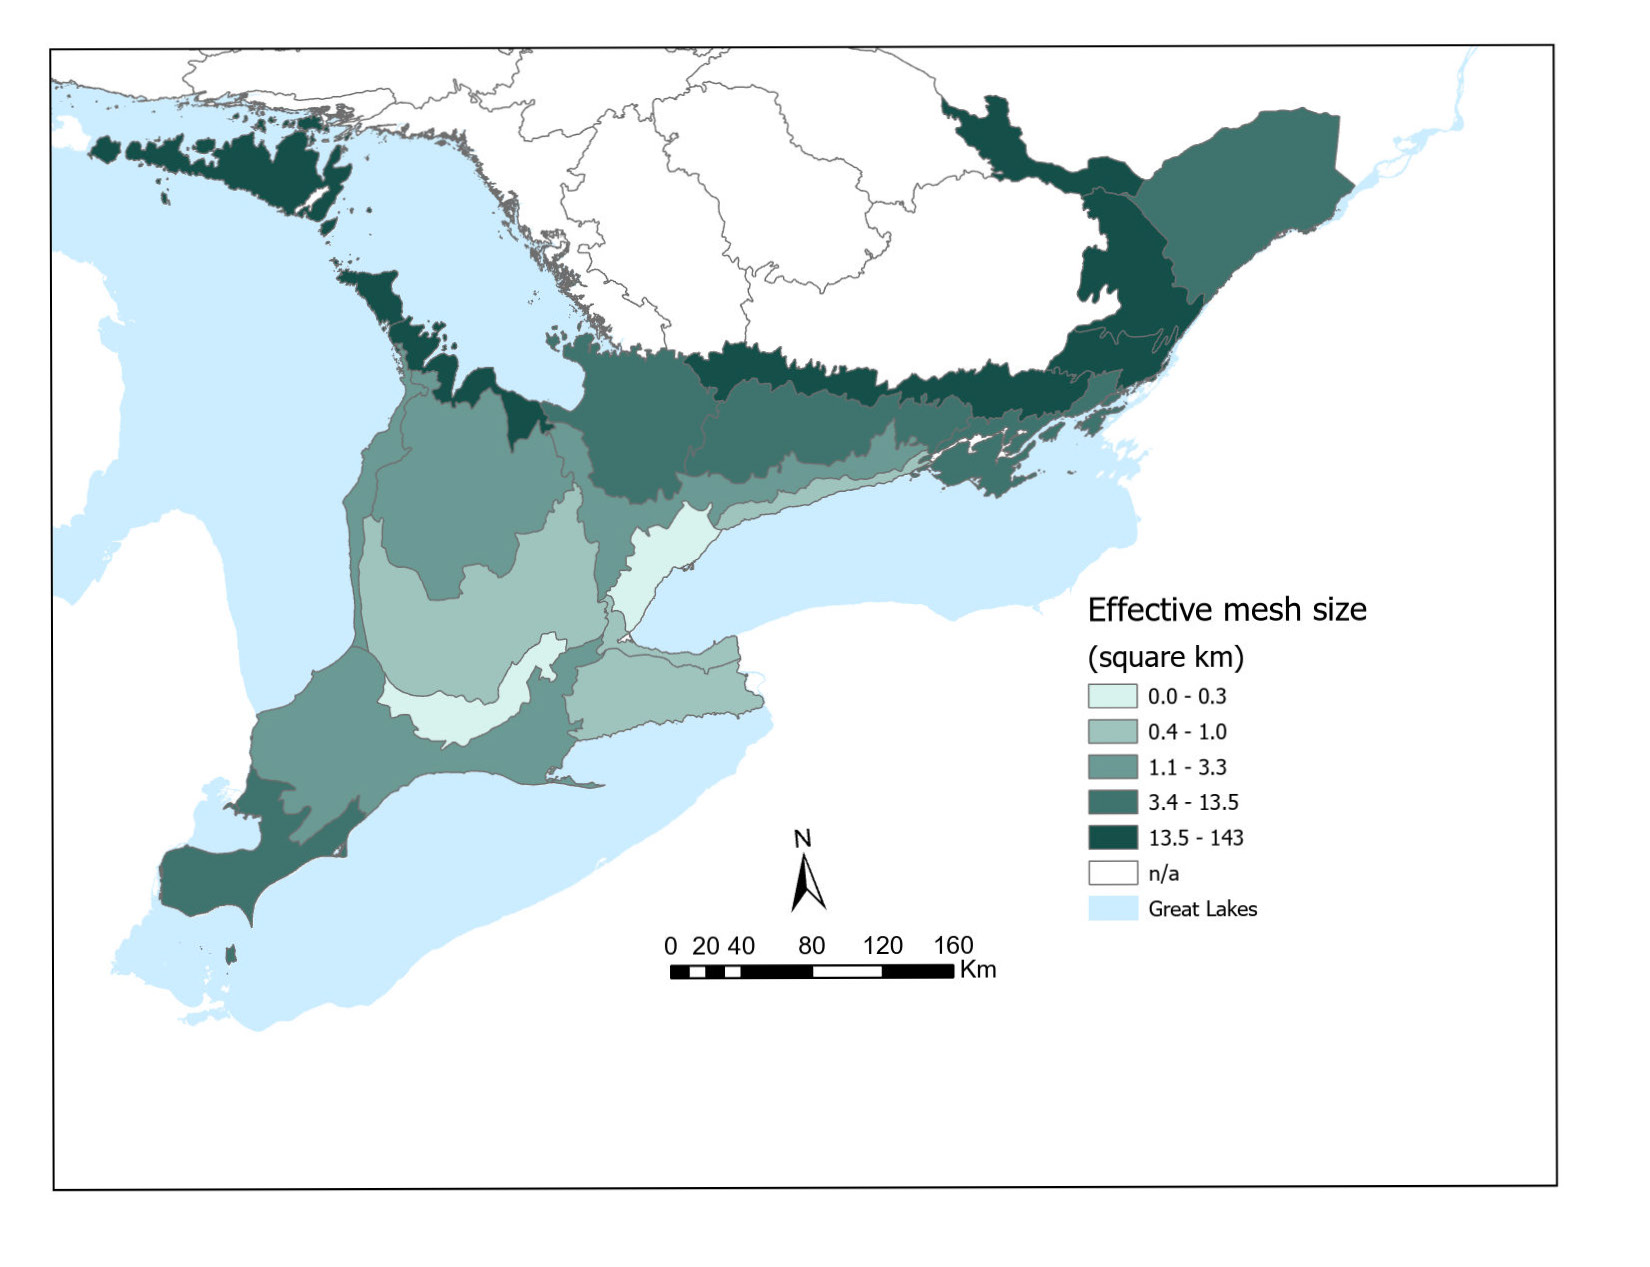
Figure 3. Effective Mesh Size for ecodistricts in southern Ontario 2015 and 2020. The larger the area in km² the less fragmentation in the area (OLC v1, 2025). *please note changes to effective mesh size can be attributed to real increase/decreases and improved data methodology. Agricultural lands are not measured as a barrier using this model which can make southwestern Ontario(specifically ecodistrict 7E-1 look less fragmented than it is.
Status:
- In 2020, habitat patch size across the province shows that sizes range from as low as 0.12 km², in the Toronto area and as large as 580,000km² in Agutua Moraine (Northwestern Ontario) in the northern part of the Ontario Shield.
- The Ontario Shield is the largest ecozone in the province, spanning a vast area and encompassing a variety of habitats and landscapes. Habitat patch sizes in this area range from 400 km² to over 580,000 km² the largest range than any other ecozone.
- The habitat patch size in all ecodistricts within the Hudson Bay Lowlands are higher than 500,000km², showing much less fragmentation than any other ecozone.
- In 2020 the habitat patch size in southern Ontario’s Mixedwood Plain ecozone, ranged from a low of 0.12 km² in the Toronto ecodistrict to a high of 141.74 km² in the Tobermory ecodistrict. This result is similar to 2015, where the Tobermory had a habitat patch mesh size of 141.91km².
- The average patch size for the ecodistricts within the Mixedwood Plains ecozone in 2020 was 20.19 km². This is very similar to the 2015 size which had an average of 20.25 km². The average habitat patch size for the ecodistricts in the Hudson Bay Lowlands ecozone in 2020 was 577,302.42 km², and in the Ontario Shield ecozone the average was 187,827.85km².
- Seven of the eight ecodistricts with a habitat patch size of under 2 km² are found in the southwestern portion of the province. They include Toronto, London, Stratford, Grimsby, Niagara, St. Thomas, and Kincardine. Oshawa-Cobourg also has an effective mesh size under 2 km².
- To report on this indicator, we rely on analysis of spatial data and examination of changes between time periods. Currently, this analysis doesn’t allow us to directly determine the cause of changes; however, observed increases or decreases in habitat patch size can likely be attributed to both real changes in anthropogenic cover, along with improved data methodology.
Previous versions
Landscape fragmentation is the process by which habitat loss results in the division of large, continuous habitats into smaller, more isolated remnants. Scientific evidence shows that landscape fragmentation has negative effects on biodiversity (Fahrig 2003), largely resulting from the loss of the original habitat, reduction in habitat patch size and increasing isolation of habitat patches (Andrén 1994). More specifically, landscape fragmentation causes a reduction in habitat area, with associated declines in population density and species richness, and significant alterations to community composition, species interactions and ecosystem functioning (Fahrig 2003). Species occupying fragmented landscapes are also less able to shift their distributions to compensate for altered habitat quality resulting from changing climatic conditions. Thus, there is an important synergy between climate change and landscape fragmentation that may lead to increased loss of biodiversity (Varrin et al. 2008).
Landscape fragmentation not only deprives plants and animals of habitat, but also causes habitat degradation, such as increased noise, light and air pollution or changing microclimates. Some species avoid human structures, which reduces available habitats even more. As a result, areas in which animals feel undisturbed become ever more scarce due to landscape fragmentation (Jaeger 2000). Further, landscape fragmentation results in an abundance of edge habitat, where edge-sensitive species or those that require large, undisturbed habitat are unable to find suitable habitat to carry out their life processes.
Landscape fragmentation is most evident in intensively settled regions, where the habitat is divided by urbanization, agriculture, roads or other human developments (Fahrig 2003). Fragmentation continues to increase in Ontario and this trend is likely to continue as Ontario’s population is projected to grow by 41.7 per cent, or by over 6.5 million to almost 22.1 million by 2051 (Ontario Ministry of Finance, 2025), resulting in greater fragmentation of the remaining ecosystems.
Along with fragmentation, understanding landscape connectivity is important to comprehend where and how species move across the province. Landscape connectivity is the degree to which the landscape facilitates or impedes species movement among habitat patches (e.g areas where species are able to access resources necessary to carry out life processes such as food, reproduction, overwintering, etc). The types, amount, and arrangement of habitats or land use on the landscape influences the movement and ultimately the population dynamics and community structure (Taylor et al. 1993). A recent study evaluated the connectivity in Ontario using the protected area network and was able to identify areas that contribute importantly to connectivity between protected areas or other habitat patches or likewise, areas where connectivity is poor and could be restored (O’Brien et al. 2023).
Fragmentation and connectivity together can help inform priority restoration and protection of areas within the province.
In some cases fragmentation can provide isolation from competition or predation from other species, fragmentation can also create a barrier from invasive species spread. Natural rivers, streams and narrow water bodies are often not considered barriers and can be important connectors/corridors for species that swim or depend on them for seed and pollen dispersal.
Agricultural lands are not assessed as barriers using this model, however there are differences between large scale cash crops which can act as large barriers and contribute to habitat fragmentation. Area-sensitive species, habitat specialists, forest-interior species, many pollinator species, and species with limited dispersal ability (e.g, salamanders and certain invertebrates and plants) are likely to be negatively affected by habitat fragmentation caused by large-scale agriculture. In other cases agricultural lands can pose less of a barrier, where pasture-lands for livestock grazing can be managed successfully for grassland and shrub-land communities (i.e. pollinators, birds etc) and often have intact hedgerows for species movement.
This indicator assesses terrestrial landscape fragmentation in Ontario using effective mesh size, an unbiased measure of the sizes of habitat patches within regions. This indicator does not assess the measure of the barrier itself or any of its qualities. Effective mesh size is also referred to as habitat patch size in this report.
The terrestrial landscape fragmentation 2020 and 2015 results were assessed using the Ontario Land Cover (v 1.0, 2025) data for the entire province based on natural and anthropogenic land cover types. In previous reports (SOBR 2011 and SOBR 2015) the Southern Ontario Land Resource and Information System (SOLRIS v2.0 and v 3.0; OMNRF 2015) was used to assess the southern part of the province. In all reports landscape fragmentation was measured for each ecodistrict using effective mesh size (habitat patch size) (Jaeger 2000). Effective mesh size (meff) is a method to quantify fragmentation based on the probability that two points chosen at random in a region will be connected (i.e., found in the same habitat patch; Jaeger 2000). It is measured in units of area (i.e., ha or km2). The greater the value, the more likely that any two points placed at random in an area will fall within the same connected natural area.
Roads, railroads, urban development, rivers and water bodies are considered barriers. It is important to note that as a measuring unit, effective mesh size assigns equal weight to all barriers. In reality, it may make a big difference whether an animal is confronted with a small country road or a highway. While it is possible that for some species, all barriers might constitute insurmountable obstacles, for most species, it will be the nature of the barrier placed in their path (volume of traffic, width, animal-tight fences, etc.) that carries the most weight (Jaeger 2000). Agricultural lands are not considered barriers using this method.
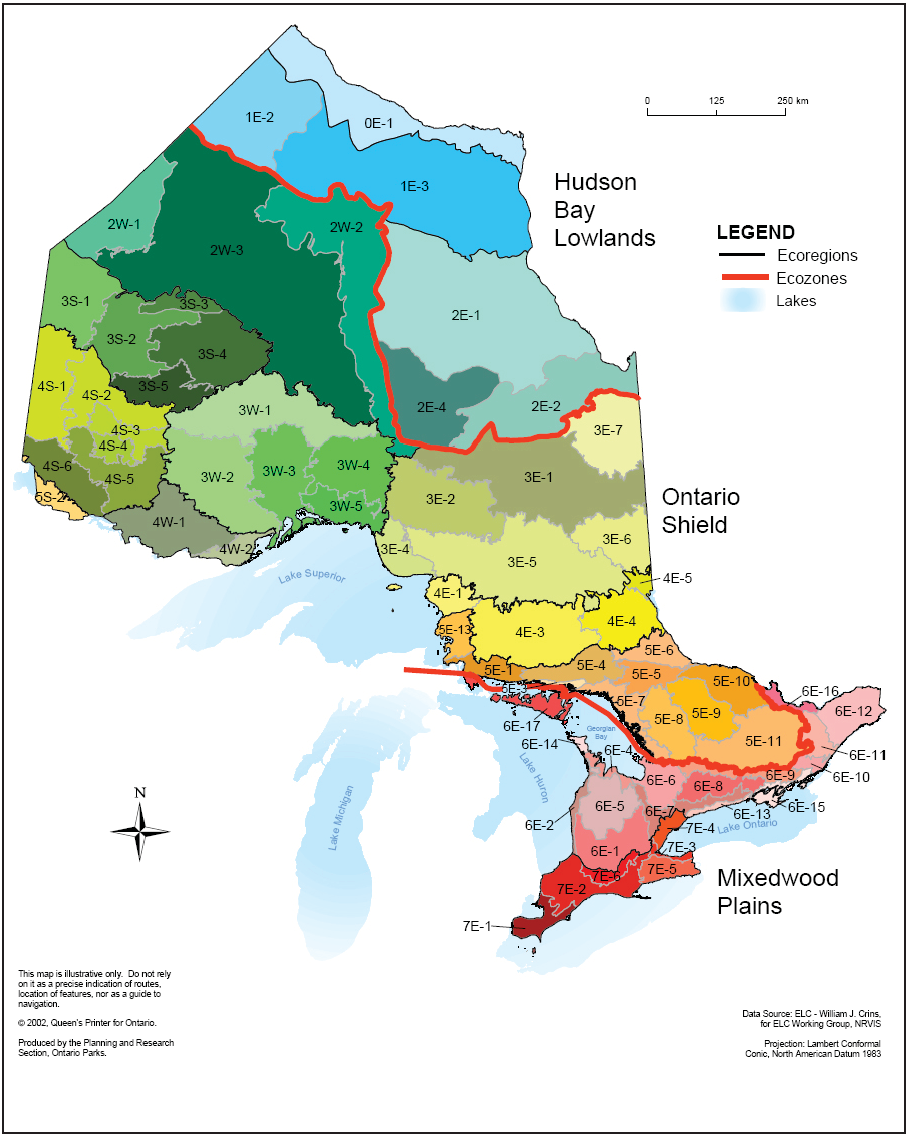
Figure 2. Ontario ecozones (red outline), ecoregions (black outline) and ecodistricts (grey outline) (MNR, 2009).
Patch-based landscape metrics can be biased by the boundaries and the extent of a reporting unit if the reporting unit boundaries fragment patches. To overcome this limitation the cross-boundary connections procedure was used, where provincial and/or ecozone borders were considered to be barriers and regional boundaries were not (Moser and Jaeger 2007). As such, meff was calculated using the following formula:
| meff |
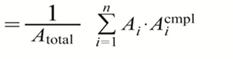 |
Where:
- n= the number of patches,
- Ai = size of patch i inside the boundaries of the reporting unit (i = 1, 2, 3, …, n).
- Ai compl = the area of the complete patch that Ai is a part of, and
- Atotal = the total area of the reporting unit.
A high effective mesh size value indicates low fragmentation of the landscape (e.g. An ecodistrict with an effective mesh size of 1 km² more fragmented than an ecodistrict with an effective mesh size of 500km²).
Related Theme(s)
Related Target(s)
Web links:
Ontario GeoHub – Ontario Land Cover Version 1.0 –https://geohub.lio.gov.on.ca/documents/667367a759214a089917adccdbae7cb2/about
Ontario GeoHub – Southern Ontario Land Resource Information System (SOLRIS) 3.0 – https://geohub.lio.gov.on.ca/documents/lio::southern-ontario-land-resource-information-system-solris-3-0/about
Ontario Ministry of Finance. Ontario’s Long-term report on the economy, 2024-46. – Chapter 1: Demographic Trends and Projections 2024
Ontario Ministry of Natural Resources. The Ecosystems of Ontario, Part 1: Ecozones and Ecoregions. 2009 – Part 1: Ecozones and ecoregions.
References:
Andrén, H. 1994. Effects of habitat fragmentation on birds and mammals in landscapes with different proportions of suitable habitat. Oikos 71:355-366.
Crins, William J., Paul A. Gray, Peter W.C. Uhlig, and Monique C. Wester. 2009. The Ecosystems of Ontario, Part I: Ecozones and Ecoregions. Ontario Ministry of Natural Resources, Peterborough Ontario, Inventory, Monitoring and Assessment, SIB TER IMA TR- 01, 71pp.
Fahrig, L. 2003. The effects of habitat fragmentation on biodiversity. Annual Review of Ecology, Evolution and Systematics 34:487-515.
Jaeger, J.A.G. 2000. Landscape division, splitting index, and effective mesh size: new measures of landscape fragmentation. Landscape Ecology 15:115-130.
McIntosh, T.E., and A. J. Dextrase. 2015. Terrestrial landscape fragmentation in Ontario. State of Ontario’s Biodiversity Technical Report Series, Report #SOBTR-04, Ontario Biodiversity Council, Peterborough, ON.
Moser, B., and J.A.G. Jaeger. 2007. Modification of the effective mesh size for measuring landscape fragmentation to solve the boundary problem. Landscape Ecology 22:447-459.
O’Brien P, Carr N, Bowman J. 2023. Using sentinel nodes to evaluate changing connectivity in a protected area network. PeerJ 11:e16333 https://doi.org/10.7717/peerj.16333
Ontario Biodiversity Council (OBC). 2010. State of Ontario’s biodiversity 2010. A report of the Ontario Biodiversity Council, Peterborough, ON.
Ontario Biodiversity Council (OBC). 2015. State of Ontario’s biodiversity 2015. A report of the Ontario Biodiversity Council, Peterborough, ON.
Ontario Biodiversity Council (OBC). 2020. State of Ontario’s biodiversity 2020. A report of the Ontario Biodiversity Council, Peterborough, On.
Ontario Ministry of Finance. 2020. Ontario population projections update, 2019-2046: based on the 2016 Census, for Ontario and its 49 Census Divisions. Queen’s Printer for Ontario, Toronto, ON.
Ontario Ministry of Finance. 2024 Ontario’s Long-Term Report on the Economy, 2024-46. King’s Printer for Ontario, 2024
Ontario Ministry of Natural Resources and Forestry (OMNRF). 2015. Southern Ontario land resource information system (SOLRIS) – data specifications version 3.0. Ontario Ministry of Natural Resources, Peterborough, ON.
Taylor, Philip D., et al. “Connectivity Is a Vital Element of Landscape Structure.” Oikos, vol. 68, no. 3, 1993, pp. 571–73. JSTOR, https://doi.org/10.2307/3544927. Accessed 30 Jan. 2025.
Varrin, R., J. Bowman, and P.A. Gray. 2007. The known and potential effects of climate change on biodiversity in Ontario’s terrestrial ecosystems: case studies and recommendations for adaptation. Ontario Ministry of Natural Resources Applied Research and Development Section, Sault Ste. Marie, ON. Climate Change Research Report CCRR-09.
