This indicator presents an index of the number of people volunteering to conserve Ontario’s biodiversity and provides a means of assessing trends in the level of public participation in biodiversity conservation in the province.
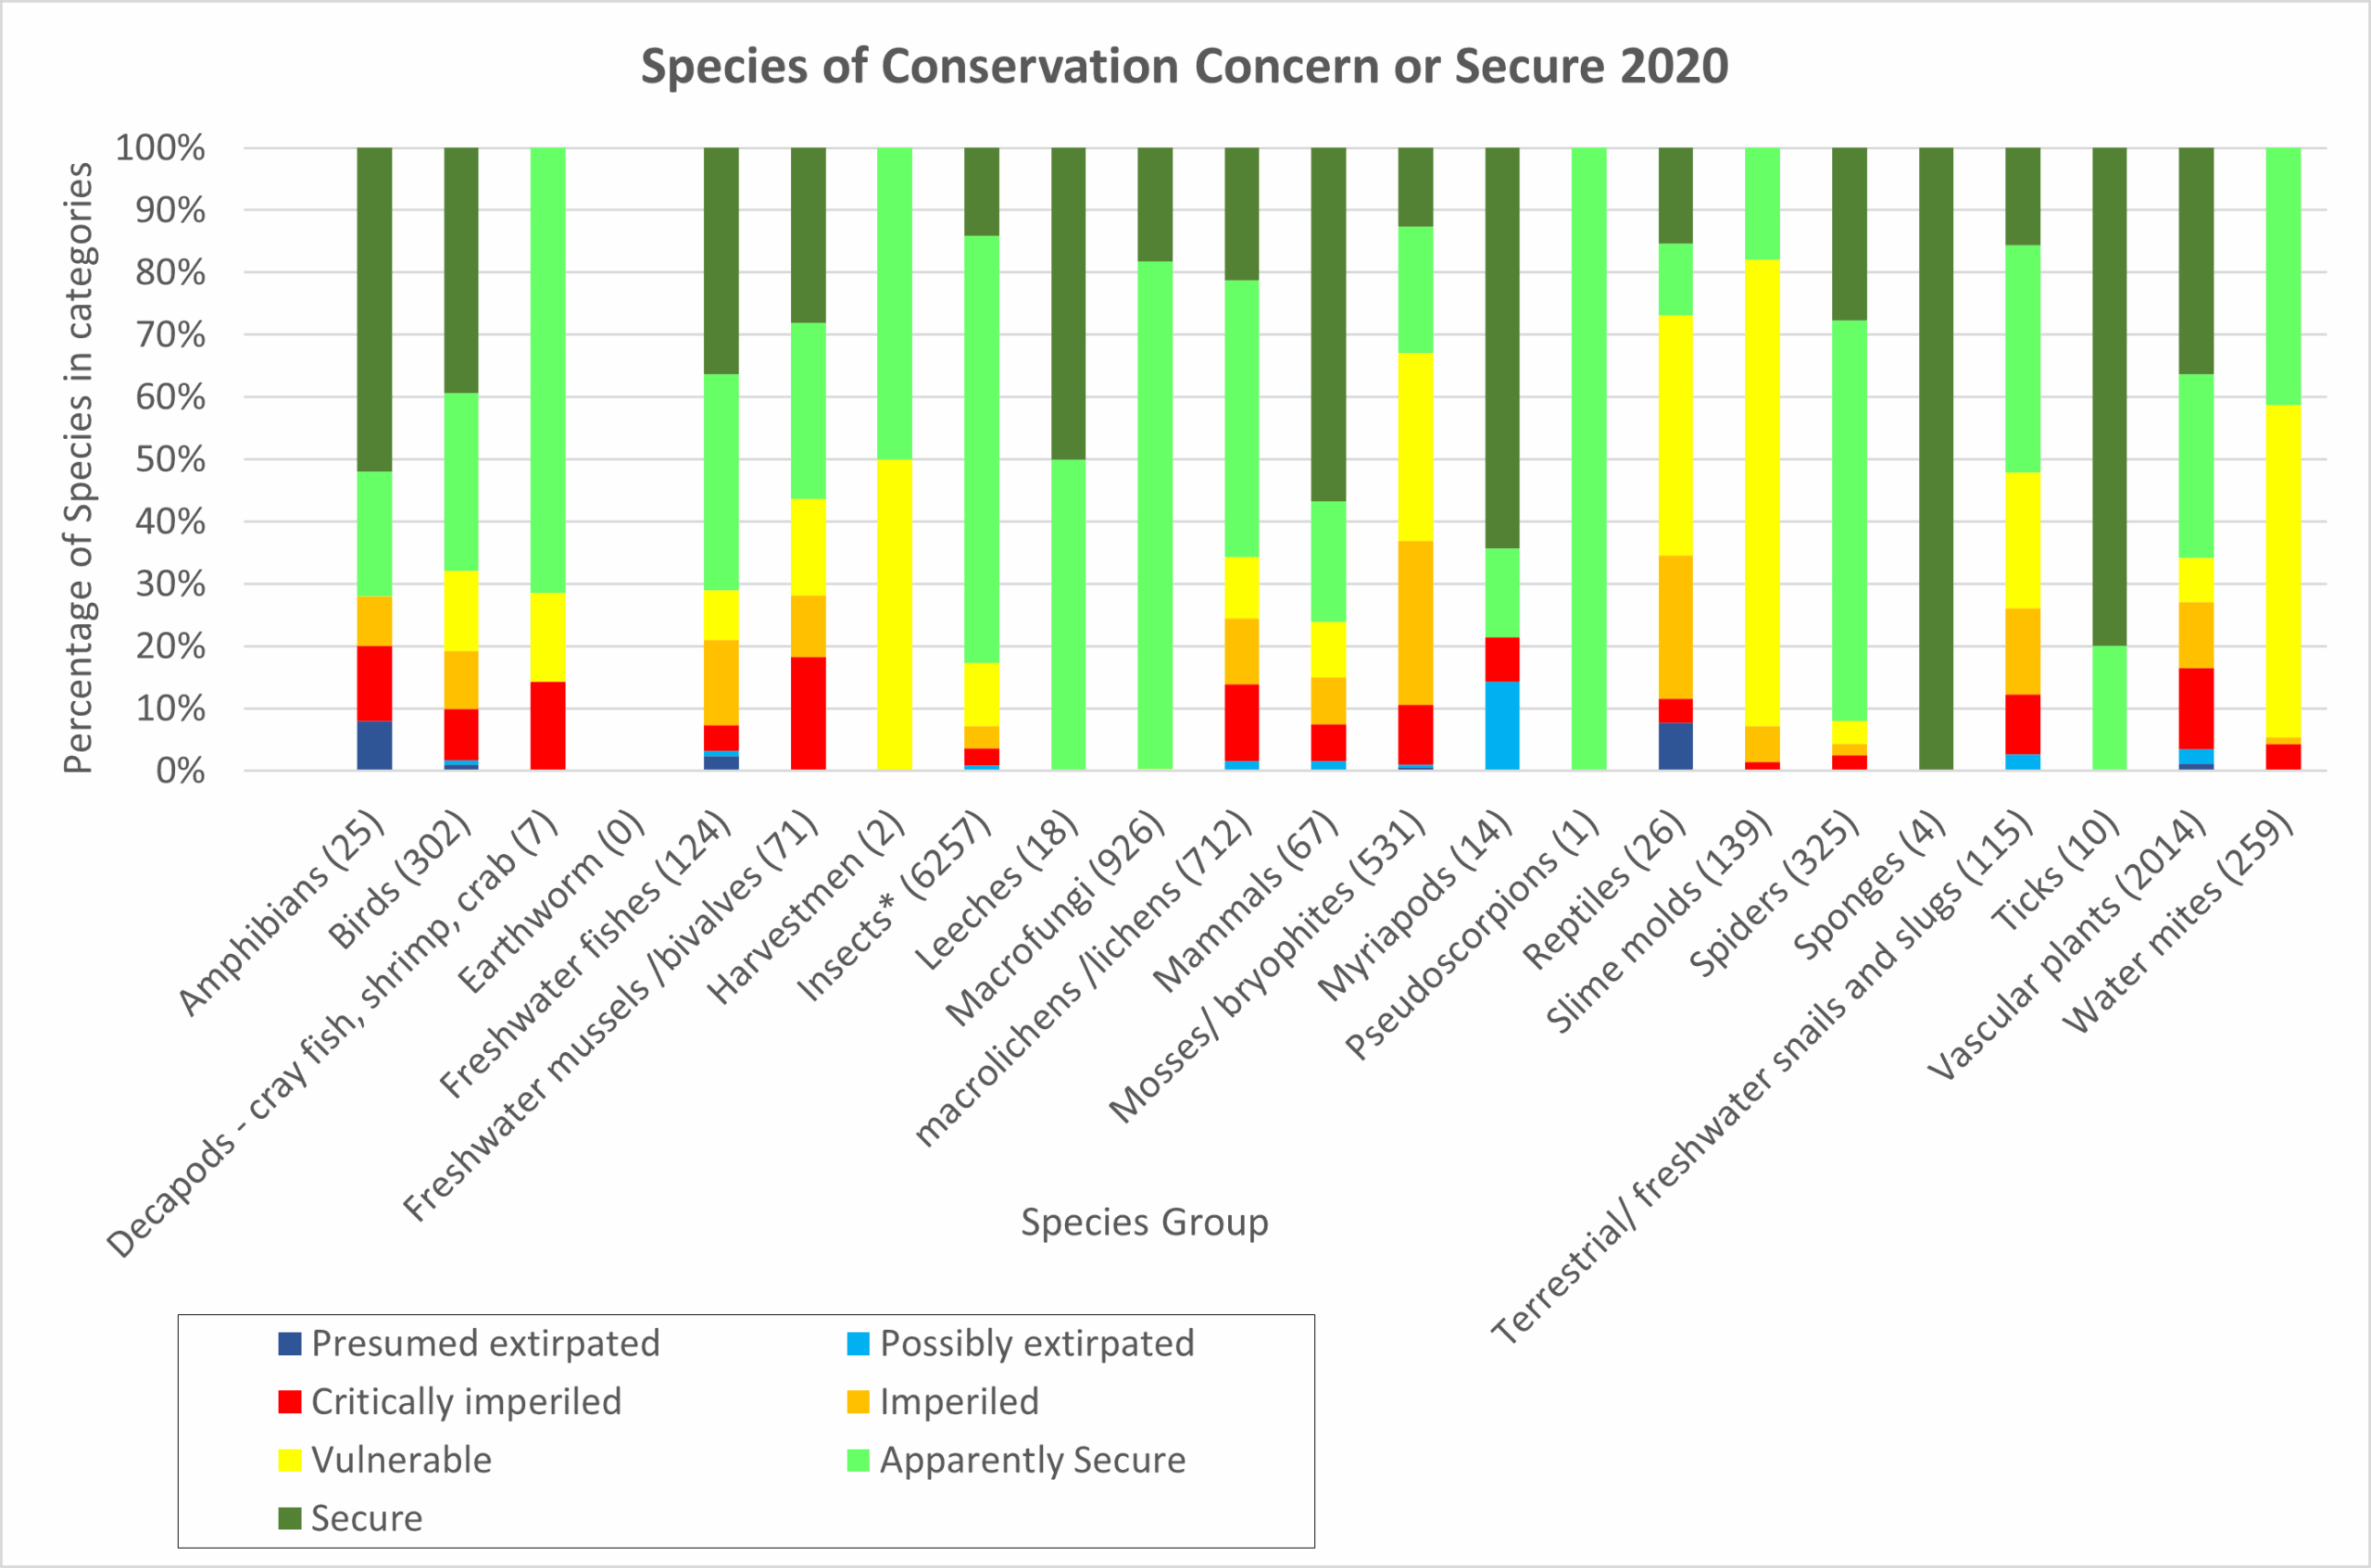
Figure 1. Proportion of Ontario native wild species assessed in secure and conservation concern categories (n = number of secure species and species of conservation concern in group). Does not include species assessed as unranked, unrankable or not applicable.
*Insects group include: ants, bees, bee flies, beetles, black flies, caddisflies, dragonflies and damselflies, fleas, flower flies, grasshoppers and relatives, horse flies, lacewings, mayflies, mosquitoes, moths and butterflies, sawflies, scorpionflies, selected flies (what does this include), springtails, stoneflies, true bugs, yellowjacket wasps.
Table 3. Species ranks for Ontario species assessed in 2005, 2010, 2015, 2020 (NHIC 2006, 2011, 2016, 2022).
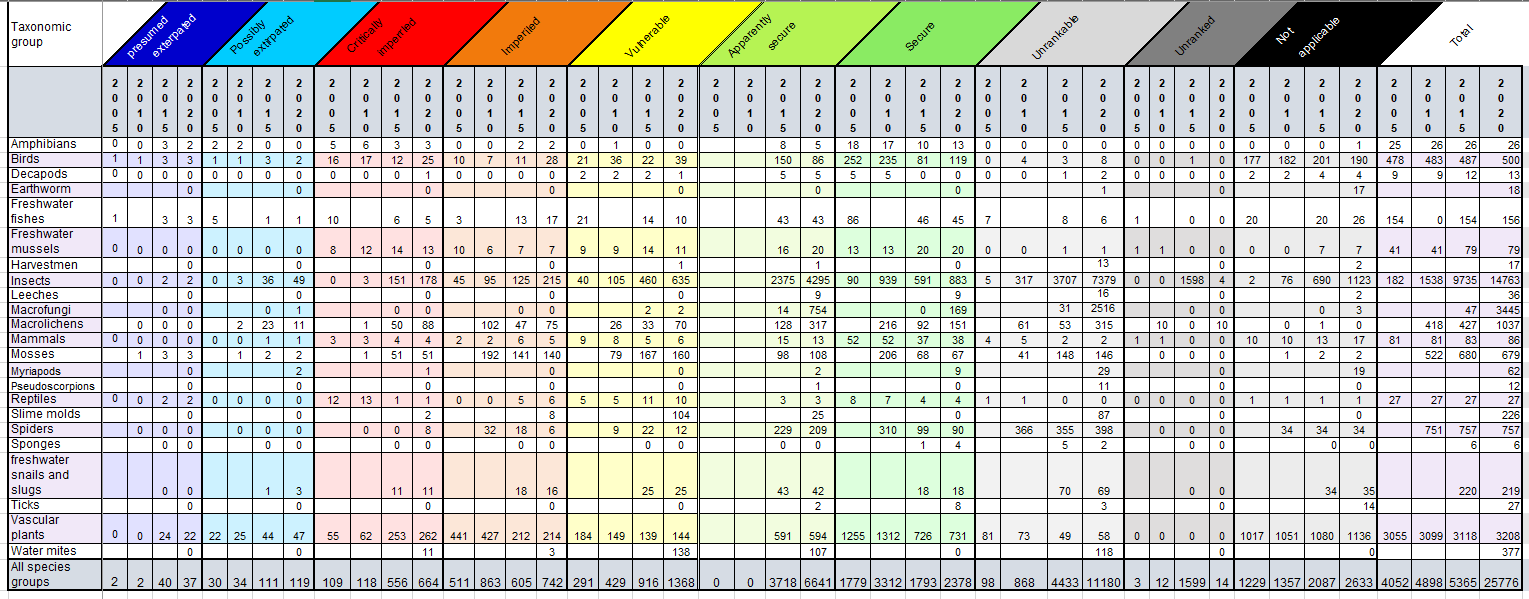
*Insect groups assessed include: ants, bees, bee flies, beetles, black flies, caddisflies, dragonflies and damselflies, fleas, flower flies, grasshoppers and relatives, horse flies, lacewings, mayflies, mosquitoes, moths and butterflies, sawflies, scorpionflies, selected flies springtails, stoneflies, true bugs, yellowjacket wasps.
Notes:
- The status of freshwater fishes was not re-assessed in the Wild Species 2010.
- Decapods in 2005 and in 2010 were strictly freshwater crayfish, in 2015 freshwater shrimp and crab were added.

Figure 2. A comparison of the conservation status of native Ontario species assessed in 2005 (n = 2,854), 2010 (n = 4,758), 2015 (n=7,739) and 2020 (n=11,949).
Table 3. Summary and reason of changes in general status ranks for Ontario species assessed in 3 time periods (2005-2010, 2010-2015, and 2015-2020). This table compares species groups that were assessed over 3 time periods to the changes in the status between those years. Only species that were assessed in both time periods being compared are included.
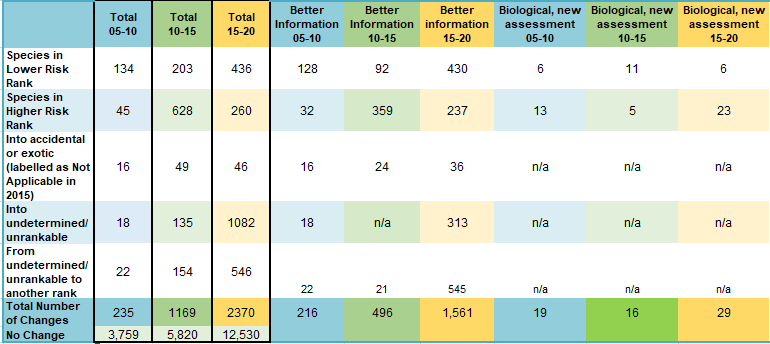
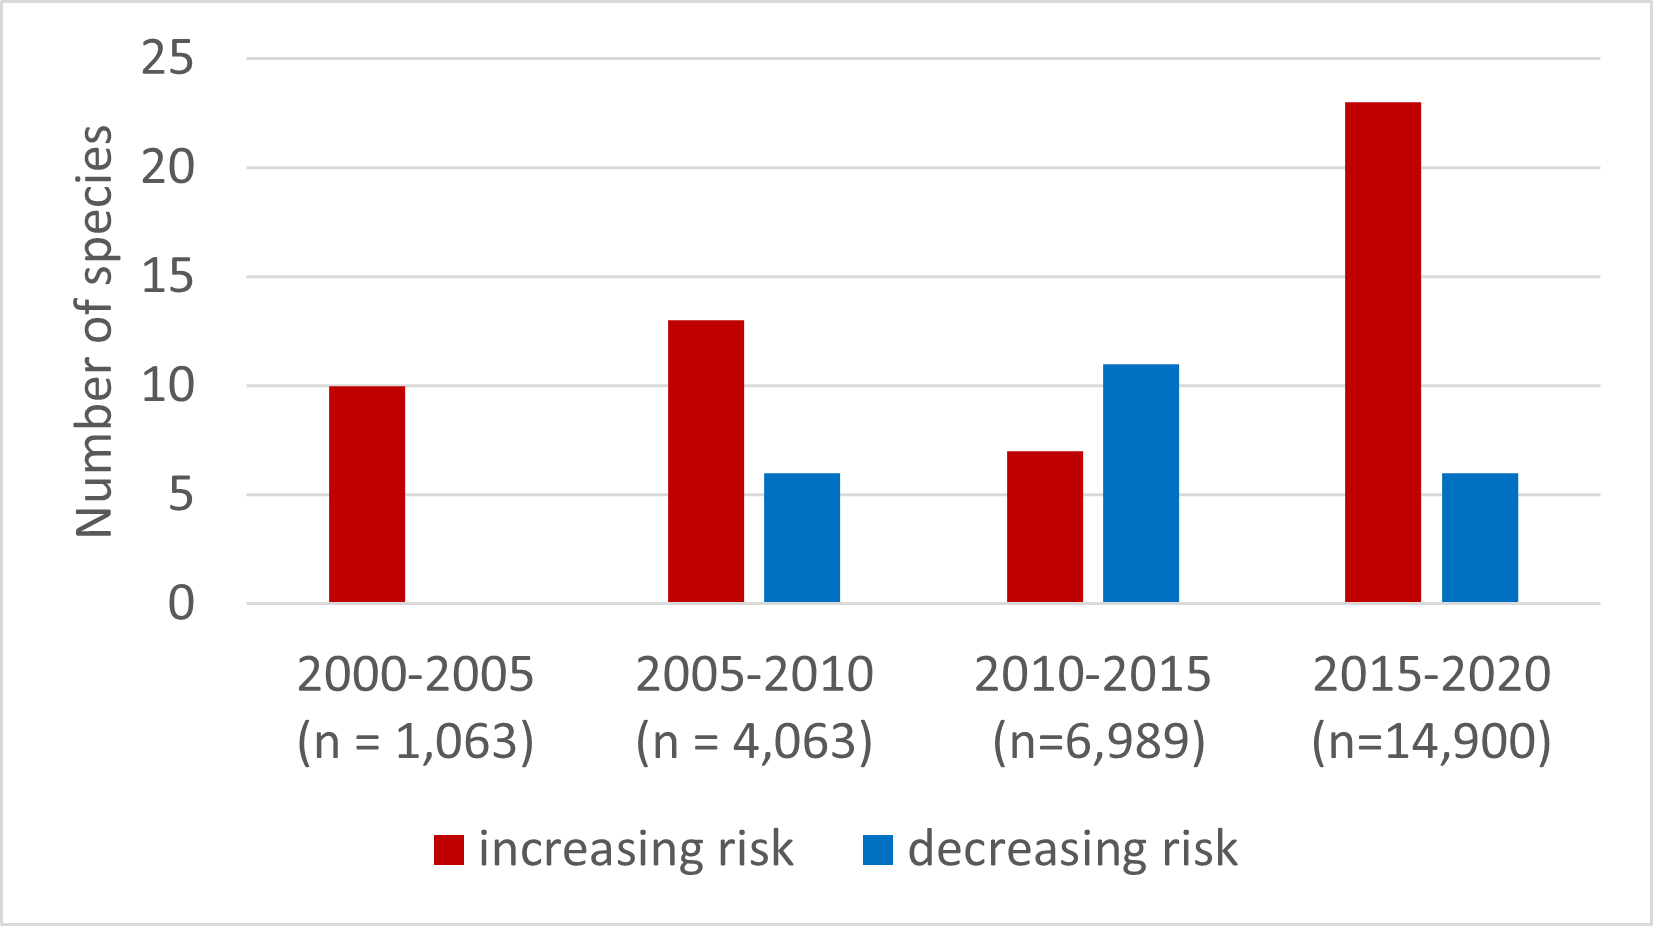
Figure 3. Number of species with real general status rank changes due to increasing risk and decreasing risk between the 4 time periods— 2000-2005 (OBC 2010), 2005-2010 assessments (OBC 2015), 2010-2015 (OBC 2020) and 2015-2020.
Status[1]:
- In the 2020 assessment, the most vulnerable species were slime molds with 114 species (82%) falling within the species of concern categories, followed by reptiles, and mosses.
- Similar to previous assessments, 19 species or 73% of reptiles were categorized as species of conservation concern (ranked as presumed extirpated, possibly extirpated, critically imperiled, imperiled, or vulnerable), the same percentage as in 2015 and similar to the 2010 assessment report at 72% (n=25).
- Of the 531 mosses that were ranked from extirpated to secure, 356 species (67%) were categorized as species of conservation concern.
- Based on the species that have been assessed, (excluding unrankable, unranked, or not applicable categories) four taxonomic groups had 100% of species ranked inthe secure or apparently secure categories, including leeches (n=18), macrofungi (926 species), ticks (10 species), and sponges (4 species)[2].
- Some of the groups with a high percentage of secure species (excluding unrankable, unranked, or not applicable categories), include spiders at 92% or 299 species, and insects at 83% (5178 species) and amphibians at 72% (18 species). Note that for insects and spiders, more than half of known species have not been ranked (insects: 8,506/14,763, or 57.6%; spiders: 432/757, or 57.1%).
- Birds were assessed at 68% secure, lower than the previous assessment which had birds at 82% secure or apparently secure and 79% in 2010.
- Though spiders were listed as one of the most secure, over half (57%) are still unrankable or not applicable. Insects also have 57% of species as unrankable or not applicable.
- Between 2015 and 2020, 2370 species that were reassessed changed general status rankings. More than half (66%) can be attributed to improved knowledge.
- Change status between 2015 and 2020 identified 23 species changed due to increasing risk. These changes can be attributed to changes in population size, distribution or threats to the species. Six species changed status due to decreasing risk.
[1] Status bullets are based on species categories presumed extirpated, possibly extirpated, critically imperiled, imperiled, vulnerable, apparently secure and secure and exclude unrankable, unranked, or not applicable categories.
[2] Some species assessed in this category did fall under unrankable, Not applicable and unranked see Table 3 for details.
The status ranks for Ontario species from the 2005, 2010, 2015 and 2020 national general status assessments (CESCC 2006, 2011, 2016, 2022) were downloaded from the national general status assessment website. For Ontario, species subnational status ranks (S-ranks) maintained by the Ontario Natural Heritage Information Centre.
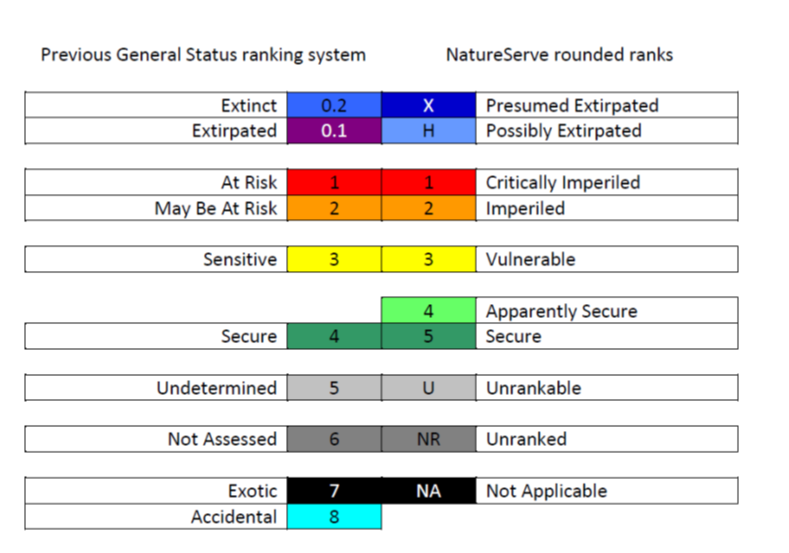
Starting with the 2015 report, the National Working Group is using the NatureServe ranking system. This is a change from early reports — 2000, 2005, and 2010, in which the general status ranking system was used. For comparison purposes the species rankings from previous years were converted to the NatureServe system (Table 2).
Table 2. Comparison of the NatureServe rounded ranks with the previous General Status ranking system (CESCC 2016).
More and more species are assessed with each update. In 2020, 25,776 species were assessed in Ontario, almost 10,000 more species than the 2015 report (15,858 Ontario species). This is also a significant increase from the approximately 7,000 assessed in 2010 and the just over 4,000 species in 2005. New taxonomic groups were added in 2020 including ticks, fleas, harvestmen, leeches, pseudoscorpions, sawflies, slime molds, springtails, myriapods, true bugs, and select flies that had not been assessed in previous reports. There were also new species added to many of the previously assessed taxonomic groups.
The number of insect groups assessed has expanded significantly since 2005, when only tiger beetles and odonates (dragonflies and damselflies) were assessed. Since then, numerous insect groups have been added and in 2020 there were more than 14,000 insects assessed including ants, bees, bee flies, beetles, black flies, caddisflies, dragonflies and damselflies, fleas, flower flies, grasshoppers and relatives, horse flies, lacewings, mayflies, mosquitoes, moths and butterflies, sawflies, scorpionflies, springtails, stoneflies, true bugs, yellowjacket wasps. To simplify presentation, all insect groups have been included in a larger general group named “insects”.
A summary of the proportion of native species in secure or conservation concern categories is presented (n=11,949) for each taxon group and for all species combined based on the 2020 assessment (Figure 1). This summary table excludes species in the exotic, undetermined, accidental and not assessed categories.
For species that were assessed in consecutive years the number of species with changes in general status ranks, and the reasons for changes were examined (Table 3). This included 4,063 species assessed in both 2005 and 2010, 6,989 species assessed in both 2010 and 2015, and 14,900 species assessed in both 2015 and 2020 (Figure 2).
The reasons for changes in status provide valuable information. Some changes in rank occurred as a result of real changes in the distribution, population size or threats to the species causing ranks to either increase or decrease in risk (see Figure 3). Many of the changes in risk were due to improved information about the species, but do not represent real changes in distribution and abundance (i.e., new survey data provided a more accurate assessment of the status of the species). Some changes in rankings also occurred due to taxonomic changes – a formerly recognized species is combined with another species, or a single species is divided into two or more species. Procedural changes and rectifying errors from the previous report also resulted in some changes in the general status of species.
Related Theme(s)
Web Links
Changes in the status of wildlife species – https://www.canada.ca/en/environment-climate-change/services/environmental-indicators/changes-status-wildlife-species-risk.html
General Status of Species in Canada http://www.wildspecies.ca/home.cfm?lang=e
NatureServe – https://www.natureserve.org/conservation-tools/conservation-status-assessment
References
Canadian Endangered Species Conservation Council (CESCC). 2006. Wild species 2005: The General Status of Species in Canada. National General Status Working Group. [Available at: www.wildspecies.ca/wildspecies2005/GS2005_site_e.pdf]
Canadian Endangered Species Conservation Council (CESCC). 2011. Wild species 2010: The General Status of Species in Canada. National General Status Working Group. [Available at: http://publications.gc.ca/collections/collection_2011/ec/CW70-7-2010-eng.pdf]
Canadian Endangered Species Conservation Council. 2022. Wild Species 2020: The General Status of Species in Canada. National General Status Working Group: 172 pp. [Available at: file:///C:/Users/GagnonRa/Downloads/Wild%20Species%202020.pdf]
Ontario Biodiversity Council. 2015. State of Ontario’s biodiversity 2015. A report of the Ontario Biodiversity Council, Peterborough, ON.
Ontario Biodiversity Council. 2021 State of Ontario’s Biodiversity 2020. A report of the Ontario Biodiversity Council, Peterborough, On
World Wildlife Fund (WWF). 2014. Living planet report 2014: species and spaces, people and places. [McLellan, R., Iyengar, L., Jeffries, B. and N. Oerlemans (Eds)]. WWF, Gland, Switzerland. [Available at: http://wwf.panda.org/about_our_earth/all_publications/living_planet_report/]
WWF (2020) Living Planet Report 2020. Bending the curve of biodiversity loss: a deep dive into the Living Planet Index. Marconi, V., McRae, L., Deinet, S., Ledger, S. and Freeman, F. in Almond, R.E.A., Grooten M. and Petersen, T. (Eds). WWF, Gland, Switzerland.https://livingplanet.panda.org/
WWF-Canada. 2020.Living Planet Report Canada: Wildlife At Risk. Currie J. Snider, J. Giles E. World Wildlife Fund Canada. Toronto, Canada. DOI: 10.13140/RG2.2.16556.49280
Pollinators are a key component of biodiversity, providing vital ecosystem services to crops and wild plants. Over 100,000 invertebrate species — such as bees, moths, butterflies, beetles, and flies — serve as pollinators worldwide. At least 1,035 species of vertebrates, including birds, mammals, and reptiles, also pollinate some plant species. The loss of wild pollinators would likely have far reaching, cascading effects on plant communities and on organisms that depend on native plants for…
Read MoreAlthough many Ontario species are secure, others are at risk of disappearing from the province due to threats such as habitat loss, invasive species, pollution, unsustainable use and climate change (Ontario Biodiversity Council 2010). Determining which species and species groups are thriving and which are rare or declining is crucial in understanding the current state of biodiversity in Ontario and targeting conservation towards those elements of biodiversity in greatest need. Provincial trends …
Read More
