The indicator reports on the number of participants preparing Environmental Farm Plans (EFPs) and the change in numbers over time. Information on the total number and geographic distribution of On-farm Environmental Projects is included to supplement the information on participants and plans.

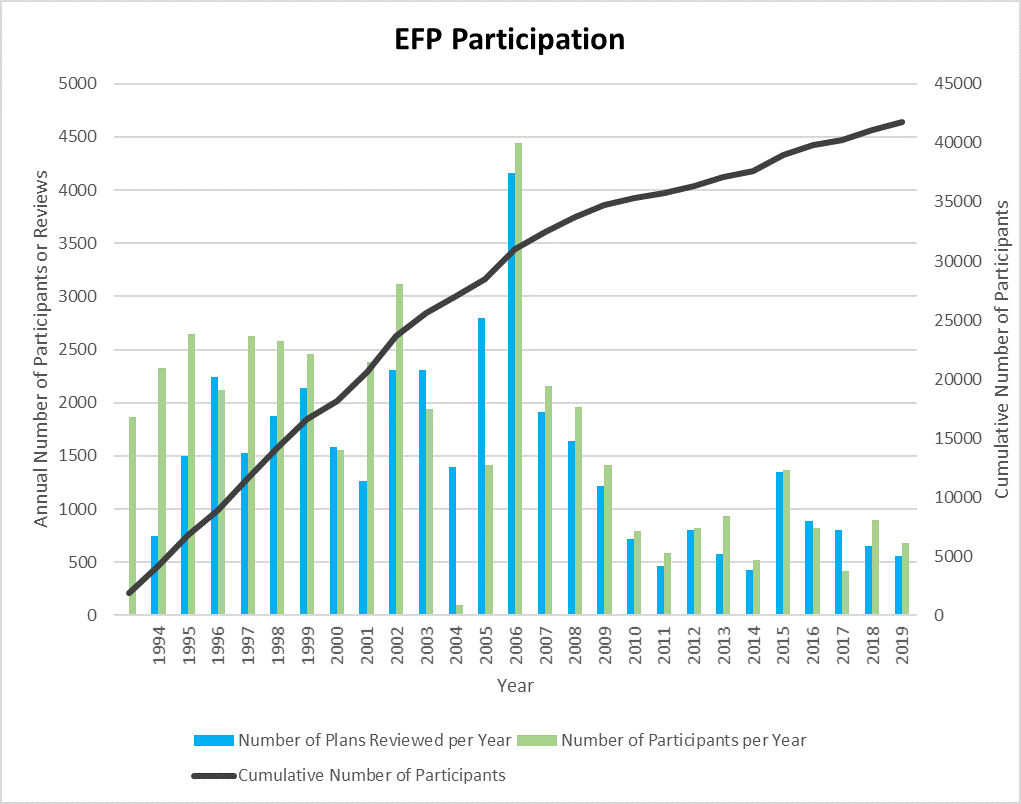
Figure 1. Number of participants in Canada-Ontario Environmental Farm Plan program, 1994–2020 (source: OMAFRA, Guelph, Ontario).

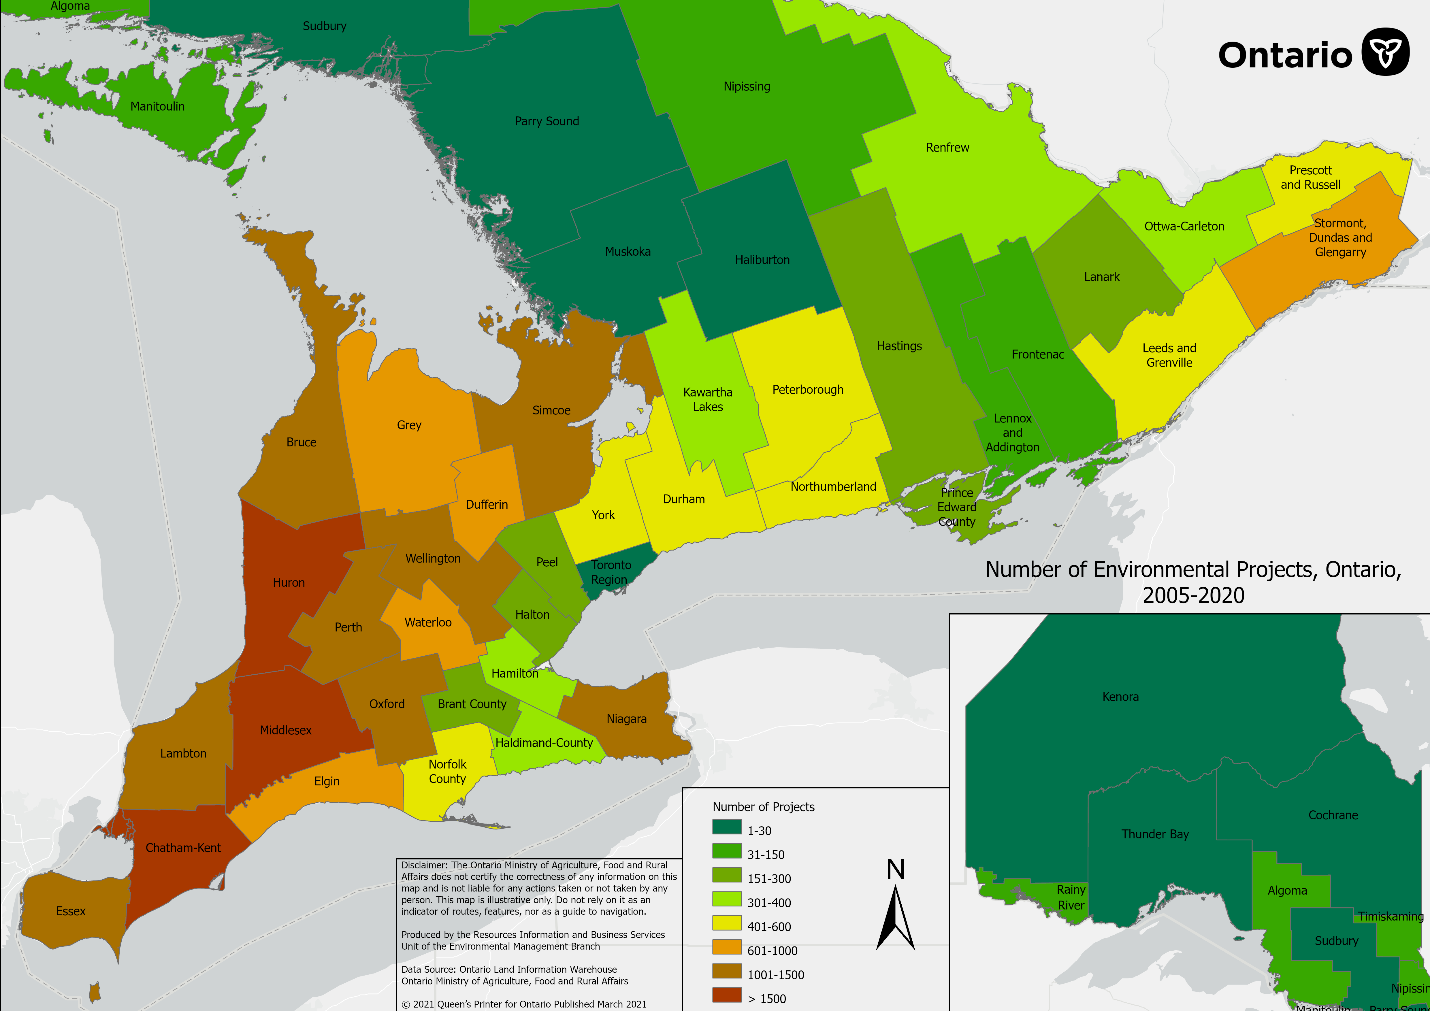
Figure 2. Number of completed On-farm Environmental Projects by Municipality (2005-2020) (source: OMAFRA, Guelph, Ontario).
Status:
- The proportion of private lands in agricultural areas managed to be more “biodiversity friendly” has increased since 2009. Participation in the Environmental Farm Plan continues to grow, but at less than 25% level in the OBS target.
- An estimated 41,000 farms (about 80% of farms) participated in the Environmental Farm Plan program during 1992-2020 (Figure 1). Since the 2015 State of Ontario’s Biodiversity report, an additional 4700 farmers have participated in an EFP workshop.
- An estimated 11% of farm businesses have completed a reviewed 4th edition of the EFP as of 2020. The 4th edition of the EFP workbook is the most current edition. Farmers are encouraged to update their plans if their farm operations change, and to review and update every five years. An estimated 30% of farm businesses had completed a 3rd edition EFP between 2005 and 2013.
- Between 2005-2020, farmers implemented more than 27,690 on-farm projects supported by government cost-share programs to achieve environmental outcomes, investing approximately $462,824,000 (Figure 2.). That is an additional 3,480 environmental projects completed with support of government cost-share programs since the 2015 State of Ontario’s Biodiversity Report. Farmers have also undertaken additional improvements using their own funds.
- In 2010 a sample survey of farmers revealed high levels of implementation of EFP action plans
- 65% of actions had been implemented in 2010, up from 54% in a similar survey in 1999.
- Significant investments were made in environmental projects, an average of $69.6K per farm with 77% of funds coming from the farmers. That amount was an increase from a reported $10.8K per farm in 1999. Furthermore, 42% of actions taken had no reported costs.
- In addition, the Species at Risk Farm Incentive Program (SARFIP), helped fund the completion of several hundred projects undertaken by farmers since 2013 not reported in Figure 2. Projects were specifically targeted at improving biodiversity and species at risk habitat. Project examples include grasslands improvements, tree shelterbelts and windbreaks, and protecting sensitive areas including forested areas and watercourses.
Previous version: Indicator-Participation-in-Environmentally-Sustainable-Agriculture-Program_May-19-2015
Ontario has about 50,000 farms and about 5 million hectares of land on farms, which includes almost 3.7 million hectares of cropland (73.1% of farm area), about 0.5 million hectares of pasture (11%) and about 0.8 million hectares of other lands (16.4%), primarily woodland and wetland (Statistics Canada, 2016). This represents about 8% of Canada’s farmland. Around 23% of farm cash receipts in Canada come from Ontario farms (Statistics Canada 2020).
The Canada-Ontario Environmental Farm Plan (EFP) program was established in 1992. It encourages farmers to incorporate sustainable practices in their farming activities. Under the EFP, farmers complete environmental risk assessments of their farming practices, and create action plans that identify best management practices to reduce risks (Government of Canada, Government of Ontario and Ontario Farm Environment Coalition 2013).
Evaluations of the implementation of EFPs took place provincially in 1999 (Plummer et al. 2007) and 2010 (Prairie Research Associates 2010). Findings from the 2010 survey of EFP participants (n=189) include the following:
- High levels of implementation of EFP action plans, 65% completed in 2010, up from 54% in 1999.
- Significant investments made in on-farm environmental projects, $69.6 thousand per farm on average, up from $10.8 thousand in 1999.
- 77% of the funds were farmers’ own funding.
- 42% of actions taken had no reported costs.
- Clear evidence of behaviour change, with the educational workshop influencing priorities (45% changed priorities after workshop).
The geographic distribution of the 27,690 on-farm environmental projects completed between 2005-2020 is shown in Figure 2. That is an additional 3,480 environmental projects completed by farmers with support of government cost-share programs, since the 2015 State of Ontario’s Biodiversity report. These projects implemented by farmers represent an investment of approximately $462,824,000.
The best management practices implemented include runoff control, improved manure storage, cover crops, and soil erosion structures, practices that have multiple environmental benefits. Other actions such as restricting livestock access to waterways, establishing vegetative buffers in riparian areas, planting treed windbreaks, and restoring wetlands help benefit biodiversity.
Many Best Management Practices have been supported through cost-sharing funding under a series of Canada-Ontario agriculture agreements from 2005 to present day: the Agricultural Policy Framework (2005-2008), Growing Forward (2008-2013), Growing Forward 2 (2013 to 2018), and the Canadian Agricultural Partnership (2018 – present). The Species at Risk Farm Incentive Program (SARFIP; Ontario Soil and Crop Improvement Association 2014) is a program that has funded specific biodiversity-related practices (Ministry of Natural Resources and Forestry and Environment and Climate Change Canada funding).
Geographic analysis of BMP adoption in Ontario by Agriculture and Agri-Food Canada (Ontario Soil and Crop Improvement Association 2012; Wozybun 2012) shows that the adoption of specific practices is linked to the specific agri-environmental risks in those geographic areas. For example, county-level adoption of manure management BMPs is highly correlated with manure production by livestock.
The indicator reports on the number of participants preparing EFPs and the change in numbers over time (Figure 1). About 41,000 (~80% of farms) have participated in the Environmental Farm Plan program during 1992-2020, ~4,700 additional farms since 2014, as reported in the 2015 state of Ontario’s biodiversity report.
The annual number of participants in the Canada-Ontario Environmental Farm Plan program and the annual number of Environmental Farm Plans reviewed each year at the provincial level were compiled for the years 1994 to 2020 (Figure 1). The cumulative number of participants in the program was also calculated. Information on the number of On-farm Environmental Projects completed from 2005-2020 was mapped at the County level in southern Ontario and at the Region and District level in the north (Figure 2). Data for this indicator are maintained by the Ontario Ministry of Agriculture, Food and Rural Affairs (OMAFRA) in Guelph, Ontario.
Web Links:
Previous version: Ontario Biodiversity Council. 2015. State of Ontario’s Biodiversity, Ontario Biodiversity Council, Peterborough, Ontario. Indicator-Participation-in-Environmentally-Sustainable-Agriculture-Program_May-19-2015
Canada-Ontario Farm Plan http://www.omafra.gov.on.ca/english/environment/efp/efp.htm
http://www.ontariosoilcrop.org/en/programs/environmental_farm_plan.htm
References:
Agriculture and Agri-Food Canada. 2009. Environmental farm planning in Canada: a 2006 overview. Farm Environmental Management in Canada, Technical Series Report. Ottawa, ON: Agriculture and Agri-Food Canada, July, 2009. [Available at: http://publications.gc.ca/collections/collection_2011/agr/A125-15-2011-eng.pdf]
Eilers, W., R. MacKay, L. Graham, and A. Lefebvre (Eds.). 2010. Environmental sustainability of Canadian agriculture. Agri-Environmental Indicator Report Series, Report #3. Agriculture and Agri-Food Canada, 2010. Ottawa, ON. [Available at: http://publications.gc.ca/collections/collection_2011/agr/A22-201-2010-eng.pdf]
Environment Canada. 2014. Canada’s 5th national report to the Convention on Biological Diversity. [Available at: http://www.cbd.int/doc/world/ca/ca-nr-05-en.pdf]
Government of Canada, Government of Ontario and Ontario Farm Environment Coalition. 2013. Canada-Ontario Environmental Farm Plan, Fourth Edition Workbook.
Ontario Soil and Crop Improvement Association. 2014. Accommodating species at risk: how Ontario farmers provide habitat for wildlife in peril through the Species at Risk Farm Incentive Program. Guelph, ON. [Available at: http://www.ontariosoilcrop.org/docs/accommodating_wildlife_booklet.pdf]
Ontario Soil and Crop Improvement Association. 2012. Environmental farm plan: right actions in the right places. Guelph, ON. [Available at: http://www.ontariosoilcrop.org/docs/2012_efp_brochure_revised_for_web.pdf]
Plummer, R., A. Speirs, R. Summer, and J. Fitzgibbon. 2007. The contributors of stewardship to managing agro-ecosystem environments. Journal of Sustainable Agriculture 31:55–84.
Prairie Research Associates. 2011. Environmental Farm Plans: measuring performance, improving effectiveness, and increasing participation. [Available at: http://stewardshipnetwork.ca/files/2012/07/Final-Report-EFPs-Measuring-Performance-Improving-Effectiveness-and-Increasing-Participation.pdf]
Statistics Canada. 2012. 2011 Census of agriculture. Statistics Canada, Ottawa, ON.
Statistics Canada. 2021. Table 32-10-0045-01 Farm cash receipts, annual (x 1,000). https://doi.org/10.25318/3210004501-eng
Statistics Canada. 2016, Table 32-10-0440-01 Total number of farms and farm operators. https://doi.org/10.25318/3210044001-eng
Statistics Canada. 2016. Table 32-10-0153-01 Total area of farms and use of farm land, historical data. https://doi.org/10.25318/3210015301-eng
Statistics Canada. 2016. Table 32-10-0406-01 Land Use. https://doi.org/10.25318/3210040601-eng
Woyzbun, E. 2012. Spatial analysis of the adoption of nutrient management related best management practices in Ontario, April 2005 – March 2010. Guelph, ON: Agriculture and Agri-Food Canada. [Available at: http://www.ontariosoilcrop.org/docs/final_report_spatial_analysis_nm_bmp_ontario.pdf]


