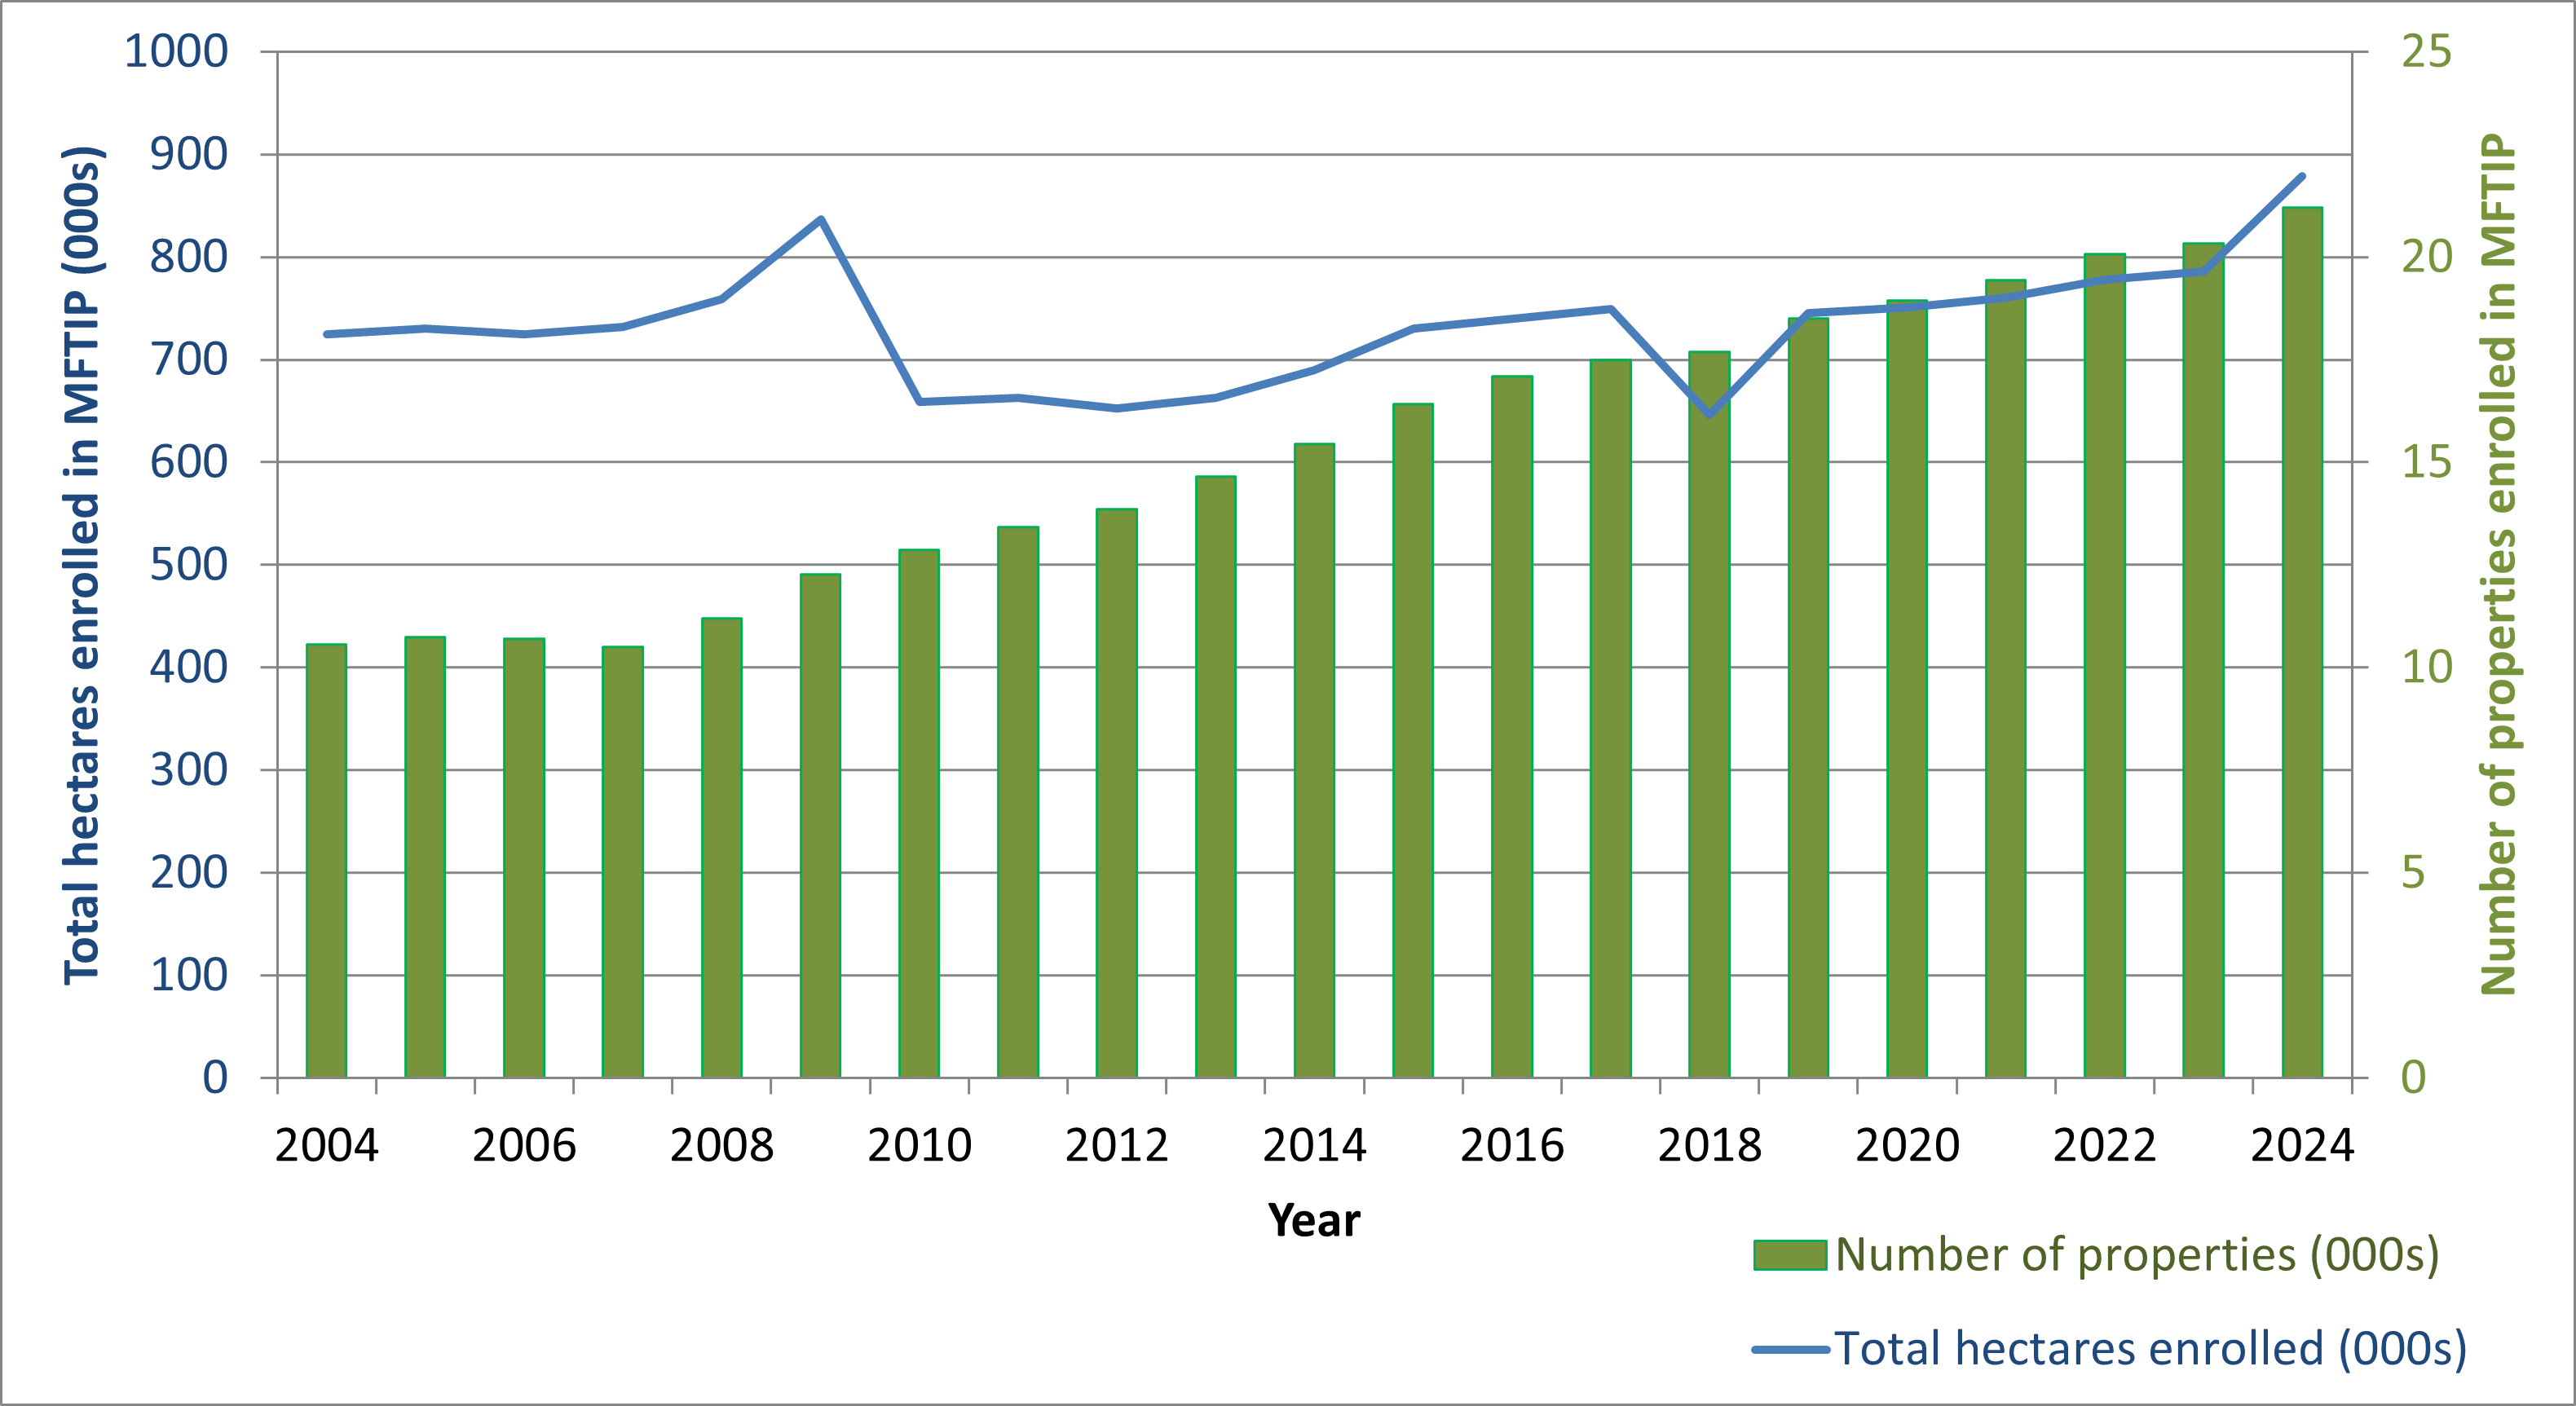
This indicator reports on the number of properties and the total area enrolled in both CLTIP and MFTIP from 2004–2024, as an indicator of participation rates in biodiversity conservation.

Figure 1. Land area and participation in the Managed Forest Tax Incentive Program 2004-2024.

Figure 2. Land area and participation in the Conservation Land Tax Incentive Program 2004-2024.
Status
- Between 2004 and 2024, the combined number of properties participating in CLTIP and MFTIP increased by 93% (from approximately 24,000 to 46,500 properties). During that same time period the area of the properties enrolled in both programs increased by approximately 32% (906,000 to 1,198,000 hectares).
- Between 2004 and 2024 the area conserved under MFTIP fluctuated with an overall increase of 21% (from 724,900 to 879,000 hectares). Some significant fluctuations in area have occurred year over year because of the changing participation of a small number of large land holdings, making the overall increase smaller. In other years, there was a general upward trend in total areas and the number of properties enrolled in the program continued to increase over time with a 101% increase between 2004–2024 (from approximately 10,500 to 21,200 properties).
- Between 2004 and 2024 the area conserved by private landowners including community conservation lands under CLTIP increased by approximately 58% (from 202,000 to 319,000 hectares). During that same time period the number of participating properties increased by 84% (from approximately 13,800 to 25,400).
Data for this indicator (2004–2024) were obtained from the Conservation Land Tax Incentive Program (CLTIP) and the Managed Forest Tax Incentive Program (MFTIP), both of which are administered by the Ontario Ministry of Natural Resources. The number of properties enrolled, as well as the total eligible area enrolled in both CLTIP and MFTIP, were compiled for the years 2004–2024. Lands owned by conservation authorities or eligible charitable conservation organizations that have a primary objective of natural heritage conservation are also eligible for CLTIP. These community conservation lands are included in the area analysis. Note that program data is approximate as data management and collection processes have evolved over the history of the program.
Related Theme(s)
Web Links:
Conservation Land Tax Incentive Program Conservation Land Tax Incentive Program | Ontario.ca
Managed Forest Tax Incentive Program Managed Forest Tax Incentive Program | Ontario.ca
References
Federal, Provincial and Territorial Governments of Canada (FPTGC). 2010. Canadian biodiversity: Ecosystem status and trends 2010. Canadian Councils of Resource Ministers. Ottawa, ON. [Available at: Canadian Biodiversity: Ecosystem Status and Trends 2010. Full Report | biodivcanada (chm-cbd.net)
Olive, A, and McCune, JL. 2017. Wonder, ignorance, and resistance: Landowners and the stewardship of endangered species. Journal of Rural Studies, 49, 13-22.
Ontario Biodiversity Council. 2010. State of Ontario’s biodiversity 2010. A report of the Ontario Biodiversity Council, Peterborough, ON. [Available at: http://viewer.zmags.com/publication/6aa 599ac]
Ontario Biodiversity Council. 2015. State of Ontario’s biodiversity 2015: Summary. A report of the Ontario Biodiversity Council, Peterborough, ON. Available at: SOBR-2015-Summary-Report_E.pdf
Ontario Biodiversity Council. 2021. State of Ontario’s biodiversity 2020: Summary. A report of the Ontario Biodiversity Council, Peterborough, ON. Available at: https://sobr.ca/_biosite/wp-content/uploads/state-of-biodiversity-report-E-FINAL-aoda-with-links-and-correction-1.pdf
Ramsdell, CP, Sorice, MG, and Dwyer, AM. 2016. Using financial incentives to motivate conservation of an at-risk species on private lands. Environmental Conservation, 43(1), 34-44.
Secretariat of the Convention on Biological Diversity. 2012. Incentive measures for the conservation and sustainable use of biological diversity: Case studies and lessons learned. CBD Technical Series No. 56. Montreal, QC. [Available at: https://www.cbd.int/doc/publications/cbd-ts-56-en.pdf]


