The aerial survey results showed a decline in polar bear numbers in SH from 2011/12 to 2016 followed by an increase (Table 1). Different estimation methods were used in the three surveys, so, although the numbers are generally comparable, a more directly comparable modeling approach showed a 29% increase between 2016 and 2021. Abundance estimates can be seen in Table 1.
Reproduction in SH, assessed from the aerial surveys, is significant but variable. For the subpopulation as a whole, over all the survey time periods, 34-36% of the subpopulation was estimated to be cubs-of-the-year (in their first year of life) or yearlings (bears between their first and second birthdays) (Tables 2 & 3). This is very high and indicates that the population has a strong potential to increase if the environmental conditions are favourable. However, there is much variability in these numbers, with as high as 30% of the population consisting of cubs-of-the-year in 2016, and only 5% consisting of yearlings in that year (meaning mortality rates were high for young bears or reproduction two years previous was low), compared to 18% for both of cubs-of-the-year and yearlings in 2021 (Table 2). This suggests highly variable cub survival and reproduction in 2021.
Biopsy mark-recapture efforts indicate that movement between WH and SH is higher than previously thought and is influenced by the location of remnant sea ice in the bay at the end of each year. Comparing bears sampled in both 2021 and 2022 — 64% of the bears sampled in SH in 2021 were again sampled in SH in 2022 while 36% of the bears sampled in SH in 2021 were sampled in WH in 2022, showing movement of the SH bears across the landscape and into other subpopulations. Ninety-three percent (93%) of the bears sampled in WH in 2021 were resampled in WH in 2022, while 7% were resampled in SH in 2022. This suggests that the increase in abundance documented in the 2021 aerial survey was at least partially driven by movements. These movements were significantly related to remnant sea ice location, with bears sampled in multiple years, tending to move further west when the last sea ice in Hudson Bay was further west.
The biopsy mark-recapture efforts also were used to develop survival estimates. These estimates are preliminary and as-yet unpublished. However, these show relative consistency in survival with past research and perhaps small increases in adult male survival. Survival estimates are outlined in Table 4.
Table 1. Polar bear abundance estimates for 2011, 2016, and 2021.
| Year |
Mean |
Lower 95% confidence limit |
Upper 95% confidence limit |
| 2011/12 |
943 |
658 |
1350 |
| 2016 |
780 |
590 |
1029 |
| 2021 |
1119 |
860 |
1454 |
Table 2. Proportion of polar bears of different age classes during each of the surveys from 2011/12, 2016 and 2021. Values below are from the distance sampling portion of the survey.
| Year |
Adult female |
Adult male |
Subadult |
Yearling |
Cub-of-the-year |
| 2011/12 |
0.36 |
0.20 |
0.08 |
0.15 |
0.19 |
| 2016 |
0.34 |
0.19 |
0.06 |
0.05 |
0.30 |
| 2021 |
0.38 |
0.20 |
0.07 |
0.18 |
0.18 |
Table 3. Proportion of polar bears of different age classes during each of the surveys from 2011/12, 2016 and 2021. Values below are from the coastal double-observer mark-recapture sampling portion of the survey.
| Year |
Adult female |
Adult male |
Subadult |
Yearling |
Cub-of-the-year |
| 2011/12 |
0.20 |
0.40 |
0.13 |
0.12 |
0.15 |
| 2016 |
0.19 |
0.52 |
0.08 |
0.03 |
0.17 |
| 2018 |
0.19 |
0.55 |
0.09 |
0.07 |
0.10 |
| 2021 |
0.22 |
0.42 |
0.09 |
0.10 |
0.12 |
Table 4. Survival estimates of polar bears in SH 2021-2024 developed from biopsy mark-recapture efforts
| Adult male |
Adult female |
Subadult |
Dependent animals |
| 0.93 (0.81-0.97) |
0.85 (0.80-0.89) |
0.87 (0.64-0.96) |
0.77 (0.62-0.88) |
Status
- Reproduction in the southern Hudson Bay subpopulation is significant but variable. Over all the survey time periods, 34-36% of the subpopulations was estimated to be cubs-of-the-year (in their first year of life) or yearlings (bears between their first and second birthdays), which is very high and indicates the population has a strong potential to increase if the environmental conditions are favourable. However, with 30% of the population consisting of cubs-of-the-year in 2016, and 5% consisting of yearlings in that year (meaning mortality rates were high for young bears or reproduction two years previous was low), compared to 18% for both of cubs-of-the-year and yearlings in 2021, this suggests highly variable cub survival and reproduction in 2021.
- In 2021 and 2022, movement between the southern Hudson Bay subpopulation (SH) and the Western Hudson Bay subpopulation (WH) was higher than previously thought and is related to remnant sea ice location. The 2022 recapture results showed that 36% of the SH bears captured in 2021 were recaptured in the WH subpopulation and only 7% of the WH bears captured in 2021 were recaptured in the SH subpopulation. Bears appear to follow the remnant sea ice location and thus come off the ice further west when the last sea ice in the HB was further west.
- Aerial survey results show a decline in polar bear numbers in the southern Hudson Bay subpopulation from 2011 to 2016 followed by an increase of 29% between 2016 and 2021.[1]
[1] Note different estimation methods were used in the three surveys, although the numbers are generally comparable, a more directly comparable modeling approach was used between 2016 and 2021 to estimate this increase.
Previous version: Body condition and survival of polar bears – 2015
Polar Bears are among the species most vulnerable to climate change because they are dependent on sea ice for feeding, mating, and resting. In many parts of the northern hemisphere, climate change is causing sea ice to break up earlier and freeze up later. In southern Hudson Bay and James Bay, the period of ice cover has decreased by almost 3 weeks since the mid-1970s (Cavalieri et al. 1996, updated yearly, Gagnon and Gough 2005; Figure 1). This reduces the amount of time Polar Bears can spend on the ice feeding on seals and other marine mammals to support reproduction and their seasonal fast (Stirling et al. 1999).
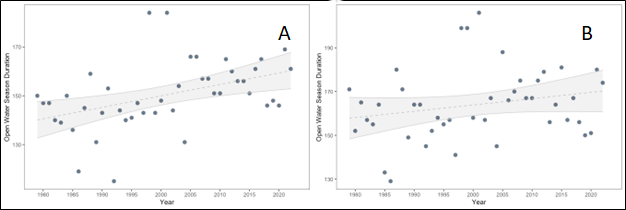
Figure 1. Annual duration of at least 15% ice cover on southern Hudson Bay (A) and James Bay (B), 1981-2023 (analysis by T. Ross (York University) J. Northrup (OMNR) based on satellite data from Stern and Laidre, 2016, updated yearly).
The loss of sea ice due to climate change is expected to have an early effect on the southern Hudson Bay subpopulation (SH) of Polar Bears, which is the southern most subpopulation in the world (Derocher et al. 2004). This subpopulation is currently estimated to contain about 1,119 bears (Northrup et al. 2025), and a decline in population size is expected as the effects of climate change are realized (Obbard et al. 2007). Such declines have been observed elsewhere. For example, the Western Hudson Bay subpopulation of Polar Bears (shared by Manitoba and Nunavut) has shown declines in body condition, reproductive success, and survival potentially resulting in a significant reduction in population size between 1987 and 2021 (Stirling et al. 1999; Regehr et al. 2007, Atkinson et al. 2022).
Recent studies suggest that population size estimates are influenced heavily by movements of bears between the SH and the adjoining western Hudson Bay subpopulation (WH), complicating understanding of changes in abundance in these areas. However, an assessment of changes in body condition, survival and reproduction can provide an indication of the status of the population and, more broadly, the current effects of climate change on Polar Bears (Obbard et al. 2006).
In the previous indicator report, a body condition index value was calculated, defined as the combined mass of fat and skeletal muscle relative to body size (Cattet et al.2002) for each animal sampled over 3 time periods (1984-1985, 2000-2005, 2007-2009; Obbard et al. 2006, 2007). Declines in body condition were apparent for Polar Bears in the SH; declines were the greatest for pregnant females and juvenile bears (Figure 2). More information about these results can be found in the 2015 body condition and survival of polar state of Ontario’s biodiversity indicator report.
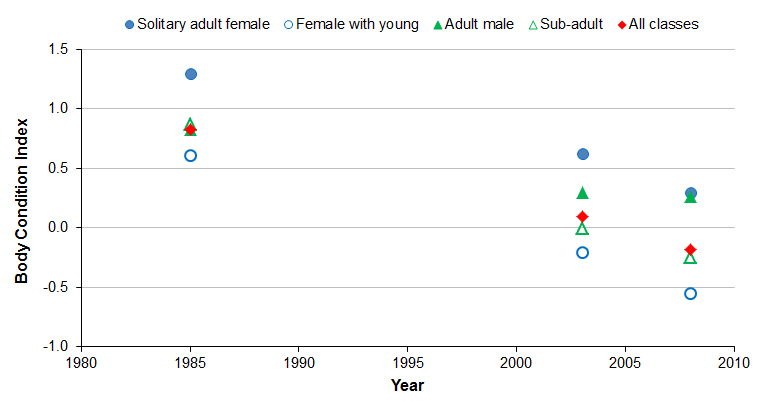
Figure 2. Changes in average body condition index values for southern Hudson Bay Polar Bears captured in Ontario during 1984-1986, 2000-2005, and 2007-2009 (median year of sample periods plotted; adapted from Obbard et al. 2006 and Obbard, unpublished data).
This indicator assesses changes in the overall health and population status for the southern Hudson Bay Polar Bears over three time periods 2011/12, 2016, and 2021, as well as reproduction over various time periods.
There were two primary approaches used to develop the results in this report. Estimates of the abundance of polar bears within the SH during the summer months were obtained through aerial surveys. These surveys were conducted using helicopter and fixed-wing aircraft and took place in 2011/12, 2016 and 2021 uwing a combination of distance sampling techniques, censuses, and double-observer mark-recapture. A survey of a smaller portion of the area was also conducted in 2018. These surveys also provide an estimate of reproduction during the years of the survey as the proportion of cubs-of-the-year and yearlings seen during the survey. Detailed methods can be found in peer-reviewed papers outlining the results of these surveys (Obbard et al. 2015, Obbard et al. 2018, Northrup et al. 2025).
Estimates of survival and interannual movements of polar bears between SH and the adjoining WH were developed using biopsy mark-recapture. In this approach, small skin samples are obtained from polar bears by darting them from a helicopter with a biopsy dart. The resulting sample is used to extract DNA which is used to genotype bears. Samples were collected in the coastal areas in Ontario, Manitoba and the larger islands of James Bay over multiple years (2017-2024). This resulted in a series of capture and recapture events for individual bears over time which can be analyzed in a mark-recapture framework to estimate movement rates and survival[1]. Bears are classified into age classes and though the results are not exactly comparable to past results of survival general comparisons can be made with caution. Specifically, survival estimates for subadults — young bears between the ages of 2.5 and 5 are more uncertain than those from physical capture and we do not have estimates of survival for senescent animals. The inability to differentiate older, aging animals from prime-aged animals also means that survival estimates for prime-aged adults are biased low (underestimated).
More detailed methods for data up to 2022 can be found in McGeachy et al. (2023), but more recent methods are as yet unpublished and unavailable.
[1] Unlike physical capture data, which was used to obtain survival and reproduction estimates from the 1980s through 2000s (and used for the results in the 2015 indicator report), no information on the exact ages of bears is available from this data.
Related Theme(s)
Web Links:
Polar bear administrative committee for polar bear management in Canada
References
Atkinson S.N., Boulanger J., Campbell M., Trim V., Ware J., Roberto-Charron A. 2022. 2021 Aerial survey of the Western Hudson Bay polar Bear Subpopulation. Final Report. Government of Nunavut, Department of Environment, Wildlife Research Section, Status Report 2022.
Cattet, M.R.L., N.A. Caulkett, M. E. Obbard, and G. B. Stenhouse. 2002. A body condition index for Ursids. Canadian Journal of Zoology 80:1156-1161.
Cavalieri, D.J., C.L. Parkinson, P. Gloersen, and H. Zwally. 1996, updated yearly. Sea ice concentrations from Nimbus-7 SMMR and DMSP SSM/I-SSMIS passive microwave data. USA: NASA DAAC at the National Snow and Ice Data Center, Boulder, CO.
Derocher, A.E., N.J. Lunn, and I. Stirling. 2004. Polar bears in a warming climate. Integrative and Comparative Biology 44:163-176.
Gagnon, A.S., and W.A. Gough. 2005. Trends in the dates of ice freeze-up and break-up over Hudson Bay, Canada. Arctic 58:370-382.
Joseph M. Northrup, Stephen Atkinson, Eric Howe, Nicholas J. Lunn, Kevin Middel, Martyn E. Obbard, Tyler R. Ross, Guillaume Szor, Lyle Walton, and Jasmine Ware. 2025. Estimating the abundance of a polar bear subpopulation at their southern global extent. Canadian Journal of Zoology. 103: 1-14. https://doi.org/10.1139/cjz-2024-0068
Lunn, N.J., E.V. Regehr, S. Servanty, S. Converse, E. Richardson, and I. Stirling. 2013. Demography and population assessment of polar bears in Western Hudson Bay, Canada. Environment Canada Research Report, Environment Canada, Ottawa, ON.
McGeachy, D., Lunn, N.J., Northrup, J.M., Trim, V., Davis, D., and Derocher, A.E. 2023. Distributional shifts of polar bears (Ursus maritimus) in Hudson Bay in relation to sea ice dynamics, 2017–2022. Final Report. Environment and Climate Change Canada. 32p.
Northrup, J.M., and Howe, E.J. 2016. Report to the 50th annual meeting of the Federal-Provincial-Territorial Polar Bear Technical Committee. Edmonton, AB
Northrup, J.M., and Howe, E.J. 2019. Polar bear research activity in Ontario 2018. Report to the Canadian Federal–Provincial–Territorial Polar Bear Technical Committee. Edmonton, AB.
Obbard, M.E., Stapleton, S., Middel, K.R., Thibault, I., Brodeur, V., and Jutras, C. 2015. Estimating the abundance of the Southern Hudson Bay polar bear subpopulation with aerial surveys. Polar Biol. 38: 17131725. doi:10.1007/s00300-015-1737-5.
Obbard, M.E., Stapleton, S., Szor, G., Middel, K.R., Jutras, C., and Dyck, M. 2018. Re-assessing abundance of Southern Hudson Bay polar bears by aerial survey: effects of climate change at the southern edge of the range. Arct. Sci. 4: 634–655. doi:10.1139/as-2018-0004.
Stern, Harry L., and Kristin L. Laidre. “Sea-ice indicators of polar bear habitat.” The Cryosphere 10, no. 5 (2016): 2027-2041.
