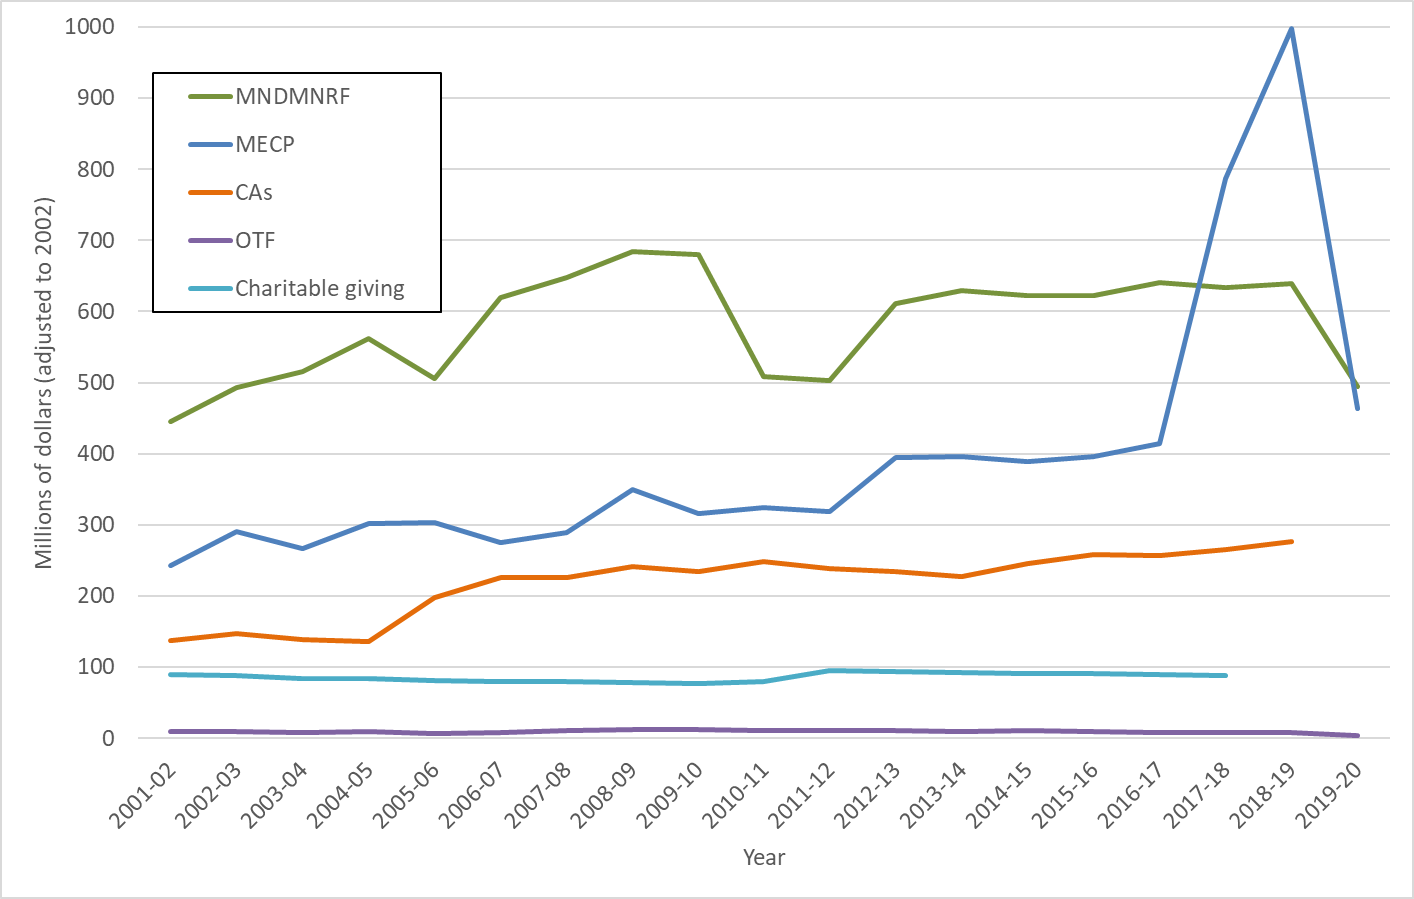
Figure 1. Provincial expenditures (adjusted to 2002 dollars) of Ontario ministries with biodiversity mandates, conservation authorities, charitable giving to the environment and environmental grants by the Ontario Trillium Foundation.

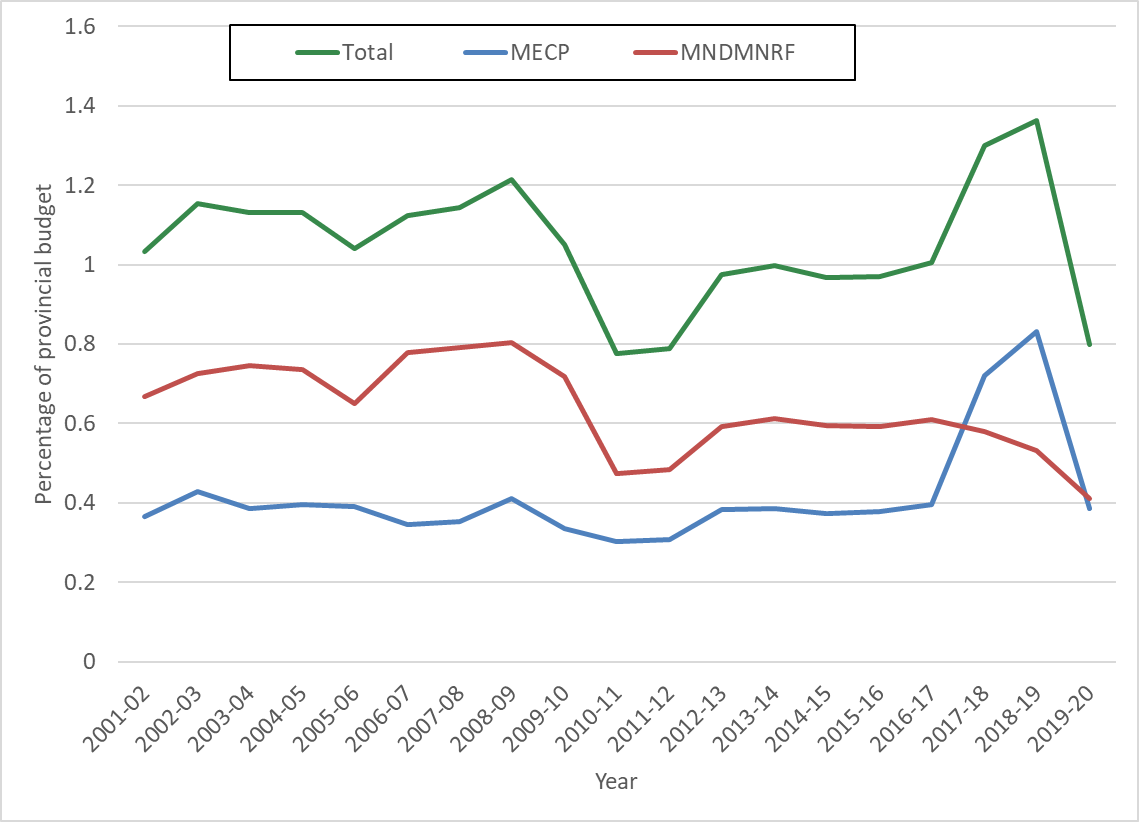
Figure 2. Percent of total provincial budget allocated to Ontario ministries with biodiversity mandates.
Status:
- From 2001–02 to 2019–20, expenditures of the biodiversity-related provincial ministries increased by 39% when adjusted to 2002 dollars ($688 million to 1.6 billion). The total provincial budget decreased by 23% during this period.
- Inter-annual and inter-ministry variability is found as budgets and ministries change over time.
- Over the last 5 years, indexed expenditures of these ministries have decreased by 6% while the provincial budget has increased by 14%.
- Between 2001-02 and 2019–20, the provincial ministries most directly involved in biodiversity conservation and management were allocated between 0.8–1.3% of the total provincial budget (average 1.05%). This is very similar to the results from the 2015 indicator report which showed allocations between 0.8–1.2% and an average of 1.0%.
- Total expenditures by conservation authorities increased by 100% between 2001–02 and 2018–19 and have remained relatively steady over the most recent 5-year period. Conservations authorities budgets are funded through a numbers of sources including municipal levies(53%), self-generated revenue (35%), provincial grants and special projects (8%), and federal grants and projects (4%). (Conservation Ontario, 2021)
- Based on surveys conducted in 2014 and 2018 charitable donations by Ontarians to environmental activities amount to $88 million annually with a decrease in adjusted value in each successive survey.
- OTF environmental grants have decreased by 19% between 2001-02 and 2019-20 when indexed to 2002 for inflation (from $9.9 million to $8.0 million).
- For perspective, it is important to note that over the period 2001 to 2019, Ontario’s Gross Domestic Product (GDP) increased from $474 billion to $655 billion in constant (consumer inflation-adjusted) dollars. Allocation of resources to biodiversity management and conservation from the provincial public sector, conservation authorities, the OTF and charitable giving averaged 0.19% of Ontario’s GDP over this period.
For the public sector, the Ontario Ministry of Northern Development, Mines, Natural Resources and Forestry and the Ministry of Environment and Climate Change were chosen because the majority of their programs align with activities relevant to biodiversity. Total expenditure estimates for these ministries and the Ontario government were obtained from estimates provided by the Ministry of Finance (OMOF 2014a). Most conservation authorities invest in a broad array of biodiversity conservation and monitoring programs across southern Ontario and parts of the north. Information on expenditures by conservation authorities was obtained from Conservation Ontario. Trends in charitable giving were assessed for environment-related donations based on Statistics Canada surveys conducted for 2004, 2007 and 2010 (Hall et al. 2006, 2009, Turcotte 2012). Information on OTF environmental grants was obtained from the Ontario Trillium Foundation.
To place the level of support for biodiversity conservation in context, trends in Ontario’s Gross Domestic Product (GDP) were examined using the Ontario Economic Accounts (OMOF 2014b). To account for inflation all monetary values reported have been adjusted to 2002 dollars based on the Consumer Price Index (Bank of Canada 2014).
Any evaluation of expenditure and financial resources faces several challenges, including the possibility of double counting and the lack of a direct relationship between expenditures and benefits for biodiversity. Some of the variability in the expenditures of the Ministry of Northern Development, Mines, Natural Resources and Forestry relate to evolving mandates (loss and inclusion of some forestry-related funding) and variation in forest fire fighting expenses. It is also important to note that not all of the expenditures from the provincial ministries selected or charitable donations to the environment provide direct benefits to Ontario’s biodiversity. For these reasons, this indicator has been deliberately narrowly scoped, knowing that additional support for biodiversity management and conservation is provided through other means (e.g., businesses, academia, conservation organizations) and exists in the programs of other government ministries. Information on environment-related expenditures of federal ministries and agencies in Ontario was not available for inclusion in this indicator at this time.
Related Target(s)
Web Links:
Ontario Ministry of the Environment, Conservation and Parks https://www.ontario.ca/page/ministry-environment-conservation-parks
Ontario Ministry of Natural Resources and Forestry https://www.ontario.ca/page/ministry-natural-resources-and-forestry
Conservation Ontario https://conservationontario.ca/Ontario
Ontario Trillium Foundation http://www.otf.ca/en/
References:
Hall, M., D. Lasby, G. Gumulka, and C. Tryon. 2006. Caring Canadians, involved Canadians: highlights from the 2004 Canada survey of giving, volunteering and participating. Statistics Canada, Ottawa, ON.
Hall, M., D. Lasby, S. Ayer, and W.D. Gibbons. 2009. Caring Canadians, involved Canadians: highlights from the 2007 Canada survey of giving, volunteering and participating. Statistics Canada, Ottawa, ON.
OMOF (Ontario Ministry of Finance). 2019. Expenditure estimates. Ministry of Finance, Toronto, ON. [Available at: http://www.fin.gov.on.ca/en/budget/estimates/ (date accessed: January 13, 2021)]
OMOF (Ontario Ministry of Finance). 2020. Ontario economic accounts. Ministry of Finance, Toronto, ON [available: http://www.fin.gov.on.ca/en/economy/ecaccts/ (date accessed: January 13, 2021)].
OTF (Ontario Trillium Foundation). 2020. Annual report and financial statements. Ontario Trillium Foundation, Toronto, ON.[Available at: https://otf.ca/our-impact/annual-report-and-financial-statements (date accessed: February 17, 2021)].
Statistics Canada. 2021. Consumer Price Index, annual average, not seasonally adjusted. Statistics Canada. [Available at: https://www150.statcan.gc.ca/t1/tbl1/en/tv.action?pid=1810000501&pickMembers%5B0%5D=1.2&cubeTimeFrame.startYear=2002&cubeTimeFrame.endYear=2019&referencePeriods=20020101%2C20190101 (date accessed: January 13, 2021)]
Statistics Canada, 2021, “General Social Survey Cycle 33: Giving, Volunteering and Participating, 2018”, [Available at: https://hdl.handle.net/11272.1/AB2/GBFDYG]
Turcotte, M. 2012. Charitable giving by Canadians. Statistics Canada — Catalogue no. 11-008, Ottawa, ON.
Turcotte, M. 2015. Charitable giving by Canadians. Spotlight on Canadians: Results from the general social survey. Statistics Canada — Catalogue no. 89-652-X2015008, Ottawa, ON.
Statistics Canada, 2021, “General Social Survey Cycle 33: Giving, Volunteering and Participating, 2018”


