Status
Calcium levels pH levels
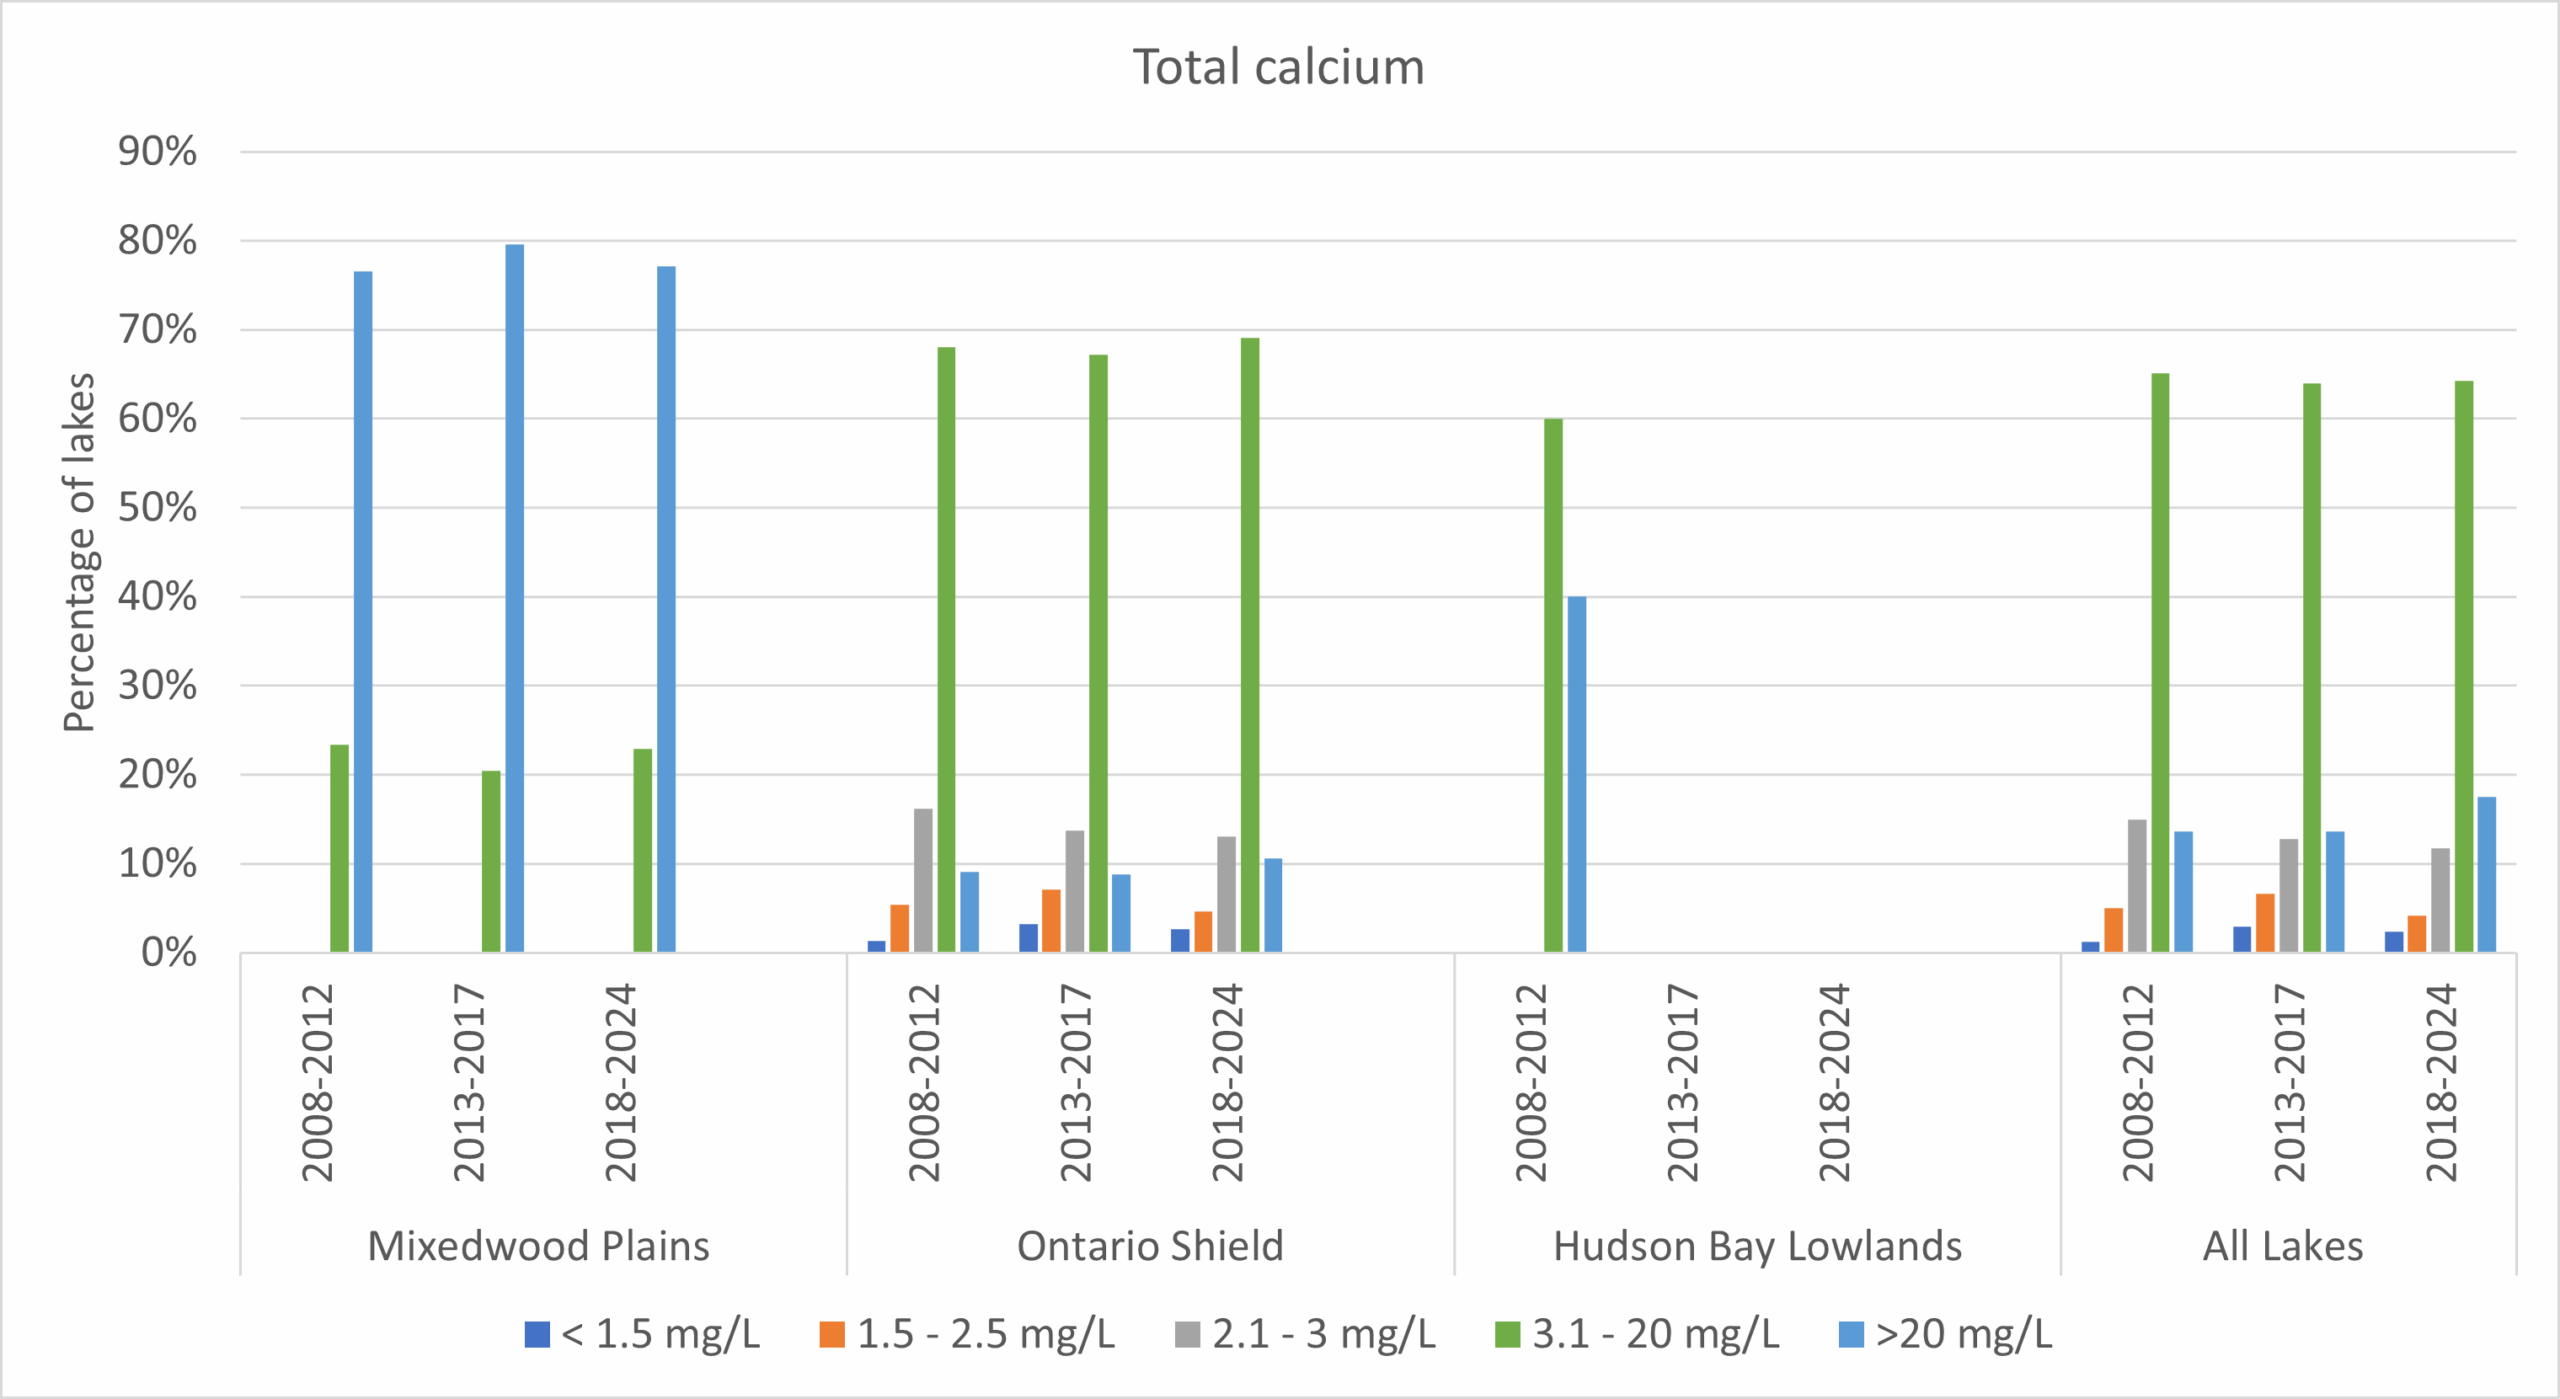
Figure 2. Status of total calcium levels in Ontario lakes sampled for calcium during cycle 1 (n=734), cycle 2 (n= 711), and cycle 3 (n=462), and percentage of lakes by ecoregion.
- Results in cycle 3 show that a total of 2% of the sampled lakes (11 lakes) had critically low calcium levels (< 1.5 mg/L). Previous cycles showed 3% (2013–2017) and 1% (2008–2012). Sixteen percent of the lakes sampled had calcium levels close to this threshold (1.5–3.0 mg/L). Previous cycles both had lakes within this range at 20%, in all cases lakes within this range were in the Ontario Shield ecozone. The Ontario Shield is an area where calcium levels are naturally low and there is evidence of declining calcium levels in soils and aquatic ecosystems.
- In cycle 3, a total of 77% of the lakes within the Mixedwood Plains ecozone were calcium rich (> 20 mg/L); previous cycles had similar results (80% in cycle 2 and 77% in cycle 1), making them more vulnerable to Zebra Mussel invasion. The Mixedwood Plains ecozone is situated on limestone and dolostone formation, making calcium levels in lakes naturally high. Calcium rich lakes also occur in the northern part of the Ontario Shield ecozone. All calcium rich lakes in cycle 3 (n=81) have pH values greater than 7.4, which is conducive to supporting Zebra Mussels.
pH levels
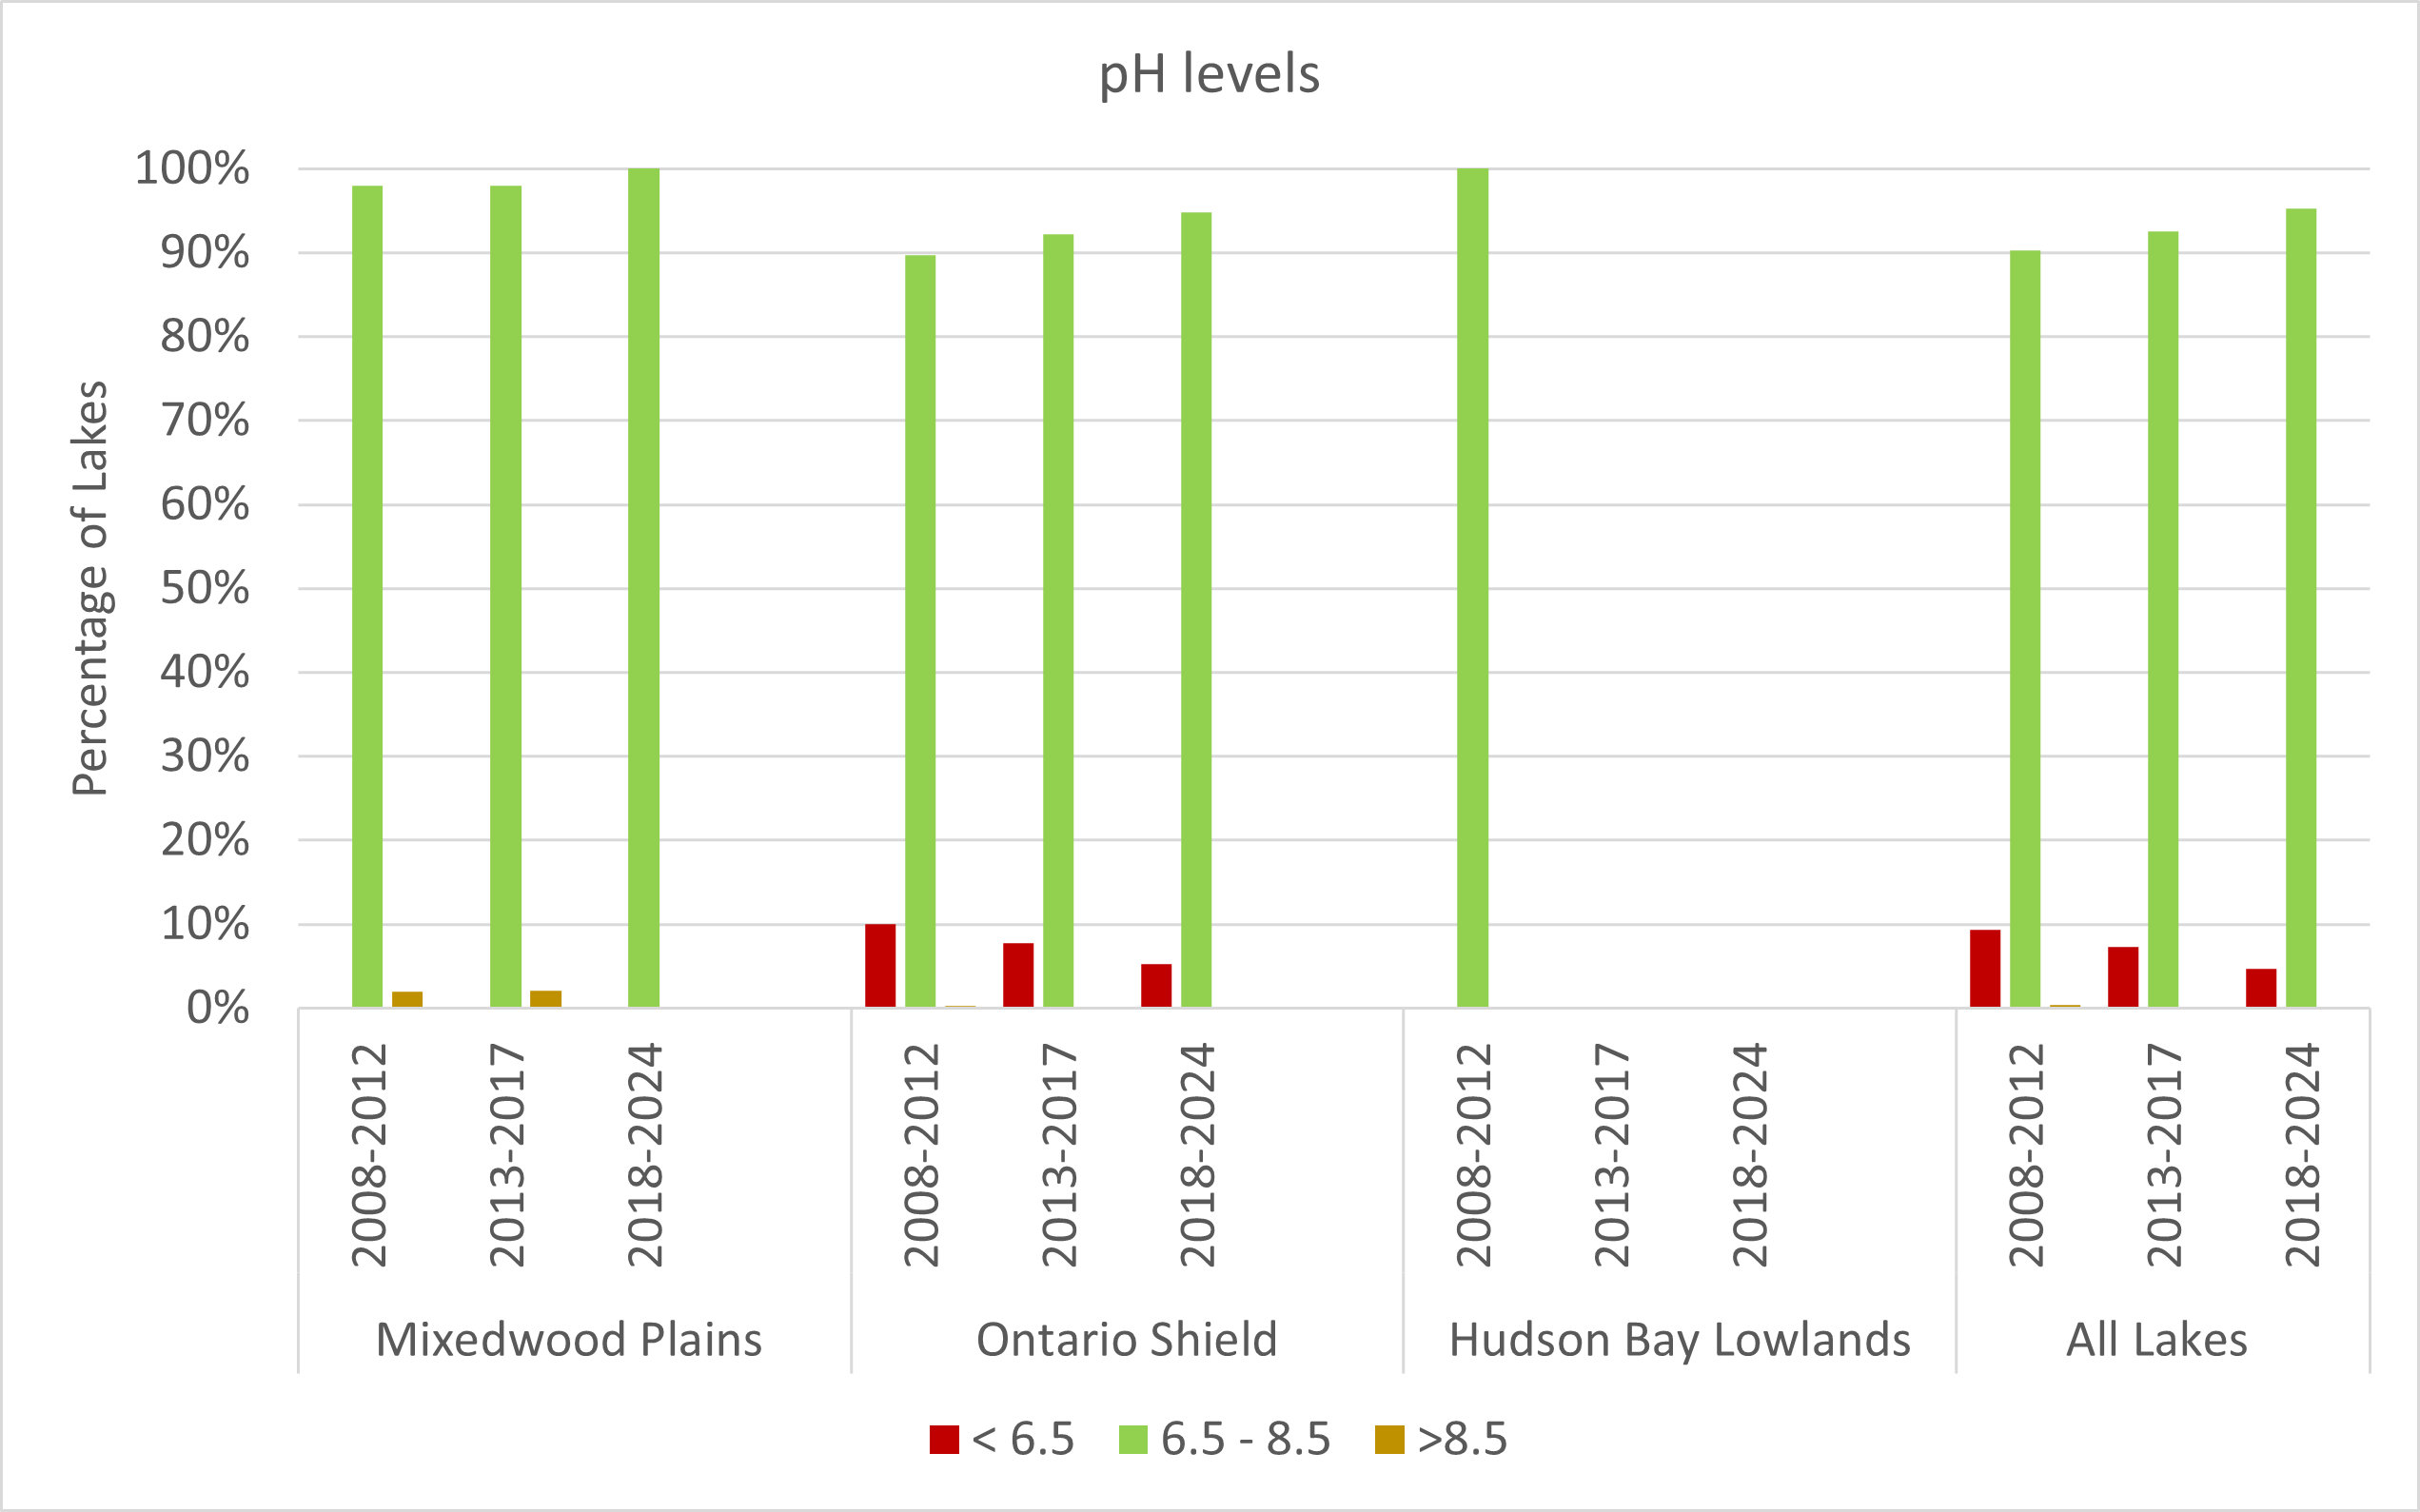
Figure 3. Status of total pH levels in Ontario lakes sampled for pH during cycle 1 (n=754) cycle 2 (n= 729), and cycle 3 (n=468), and a percentage of lakes by ecoregion.
- Between 2018–2024 (cycle 3), 95% of sampled lakes had pH values within the 6.5 – 8.5 range recommended for the protection of aquatic life. Previous sample cycles showed similar results with 93% during cycle 2 (2013–2017) and 90% of lakes during cycle 1 (2008–2012). Consistent with previous cycles, all the lakes with low pH (< 6.5) in cycle 3 were found in the Ontario Shield ecozone (n=22). Low pH values in this region can be due to a combination of factors including— the bedrock composition which leads to low pH levels in the lakes and streams, acidic soils and industrial runoff, etc.
Total Phosphorus
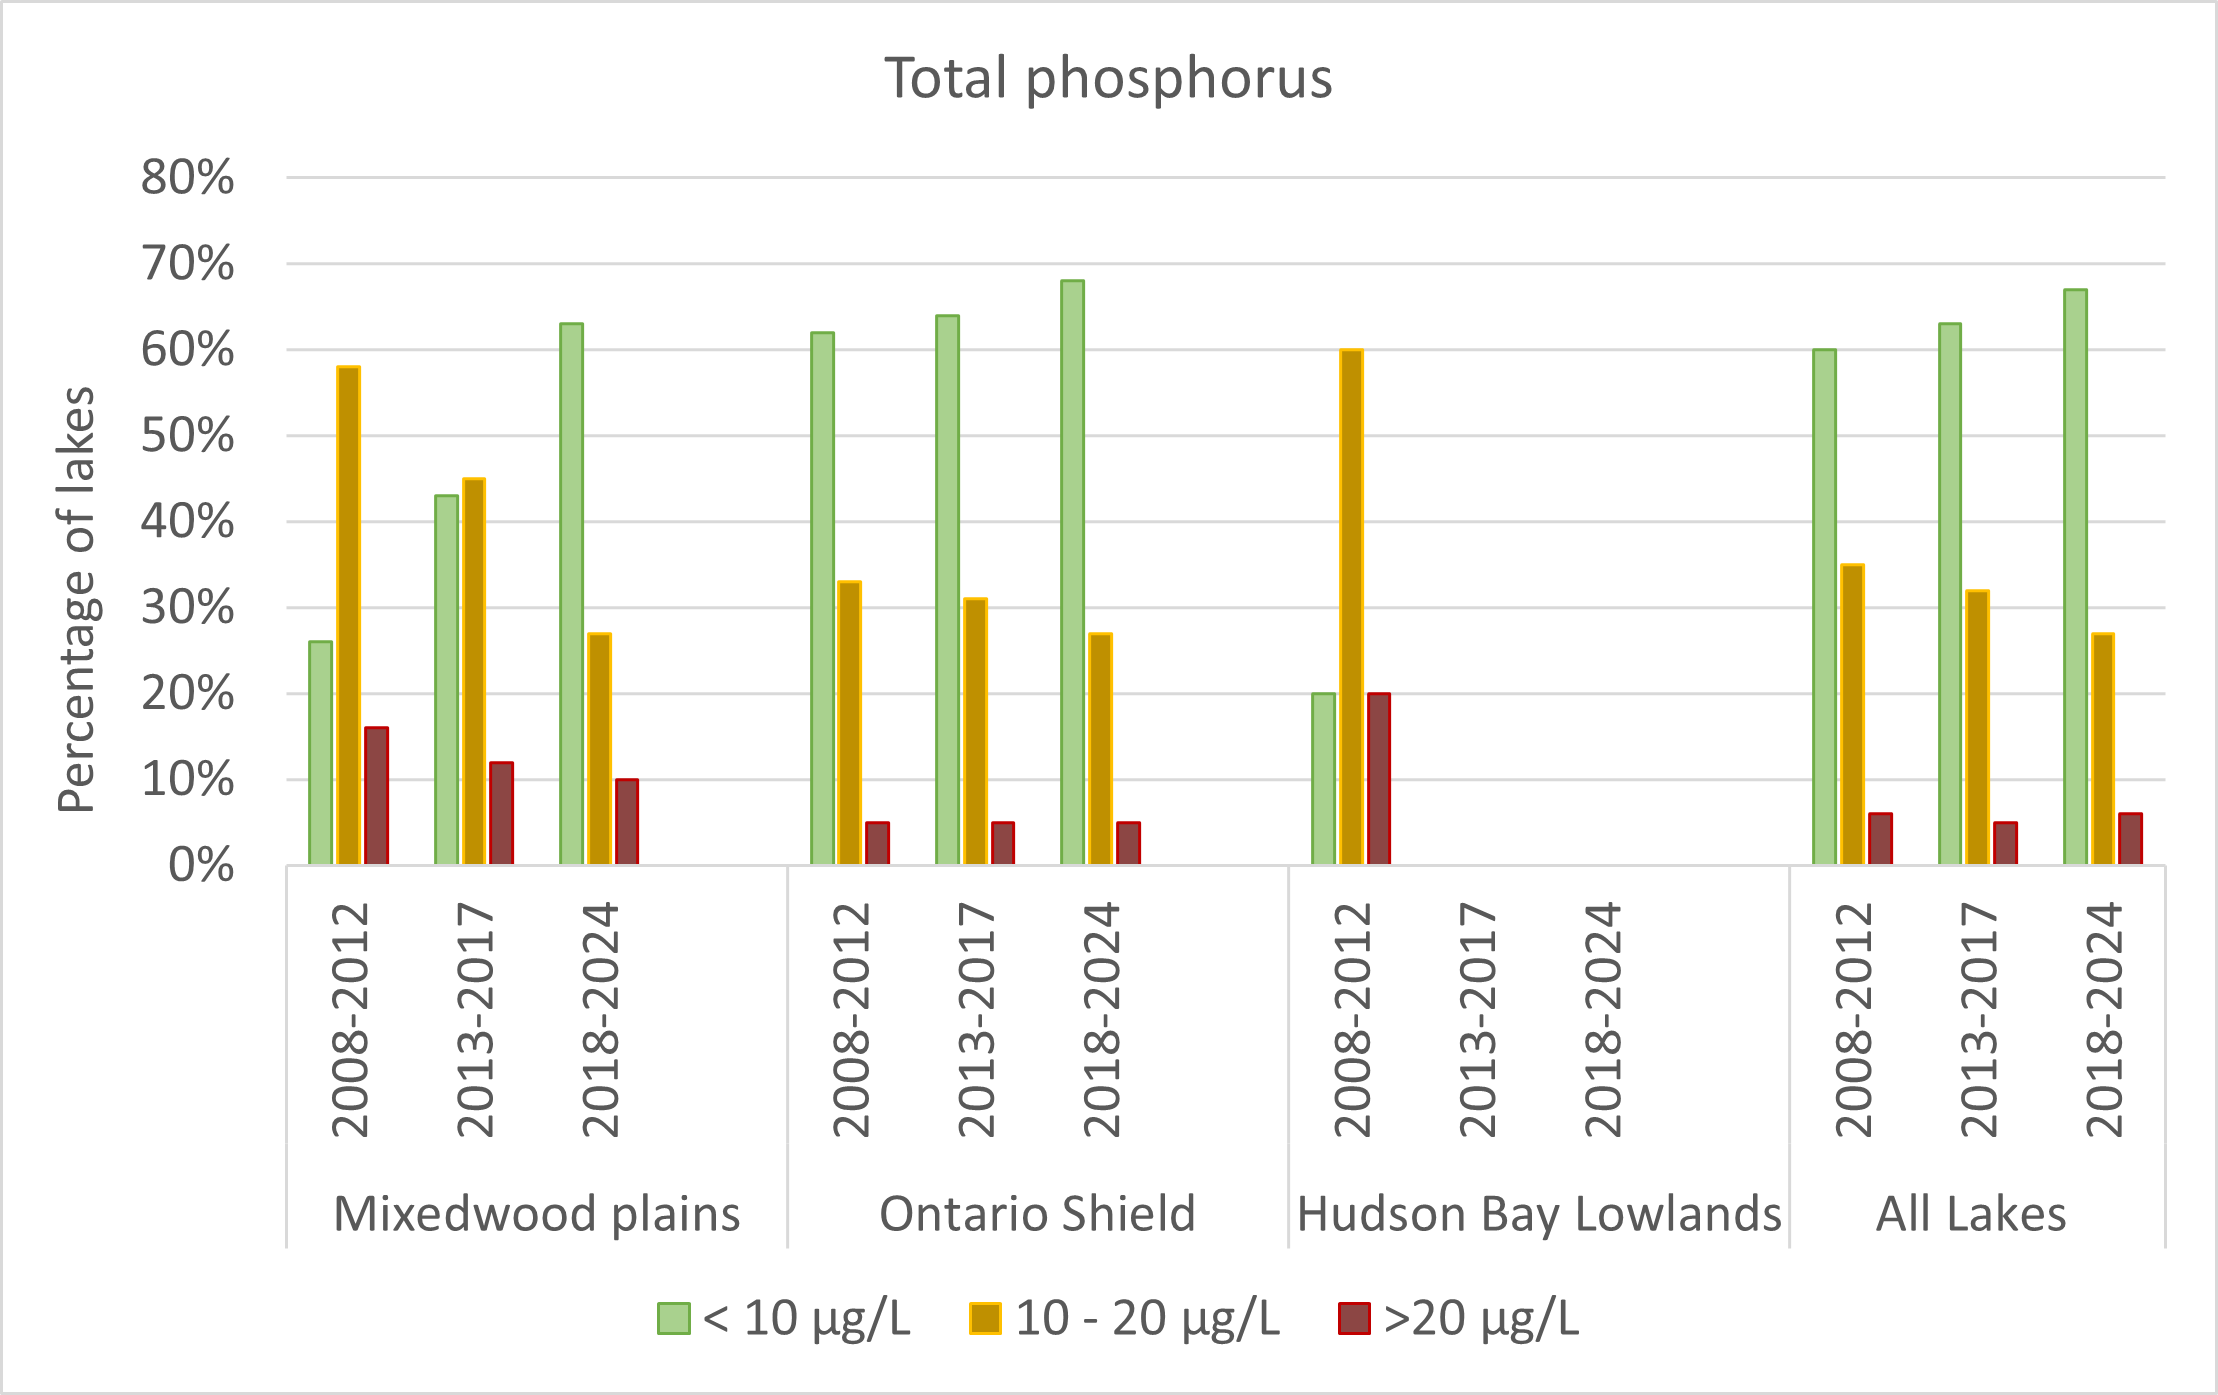
Figure 4. Status of total phosphorus levels in Ontario lakes sampled during cycle 1 (n=764) cycle 2 (n= 729), and cycle 3 (n=467), and percentage of lakes by ecoregion.
- Results show that during each sampling period (2008-2012, 2013-2017, and 2018-2024), 94% or more of the lakes were below the 20 μg/L threshold for total phosphorus, indicating there is an acceptable level of nutrients. Lakes where phosphorous levels are above 20 μg/L can result in algal blooms and excessive plant growth. Like previous cycles, the majority of the sampled lakes in the Ontario Shield (68%) have low levels of total phosphorus (< 10 μg/L).
- The Mixedwood Plains area did see some change related to lakes with low levels of total phosphorus (<10 ug/L). In cycle 3, 58% of sampled lakes were under 10ug/L, which is higher than previous cycles (26% and 43% in cycles 1 and 2, respectively), showing a trend of reduced phosphorus. Phosphorus management programs and best management guides to reduce the amount of runoff into lakes and streams in this area have been introduced over the last decade.
Data collected through Ontario’s BSM, on water quality in lakes across Ontario are compared across ecozones and over time. Calcium, pH and total phosphorus levels are collected using a standard protocol (unpublished, modified from Ingram et al. 2011). Using data from the BSM water quality assessments, this indicator compares calcium, pH and phosphorus levels in individual lakes against known thresholds that can impact biodiversity in lakes.
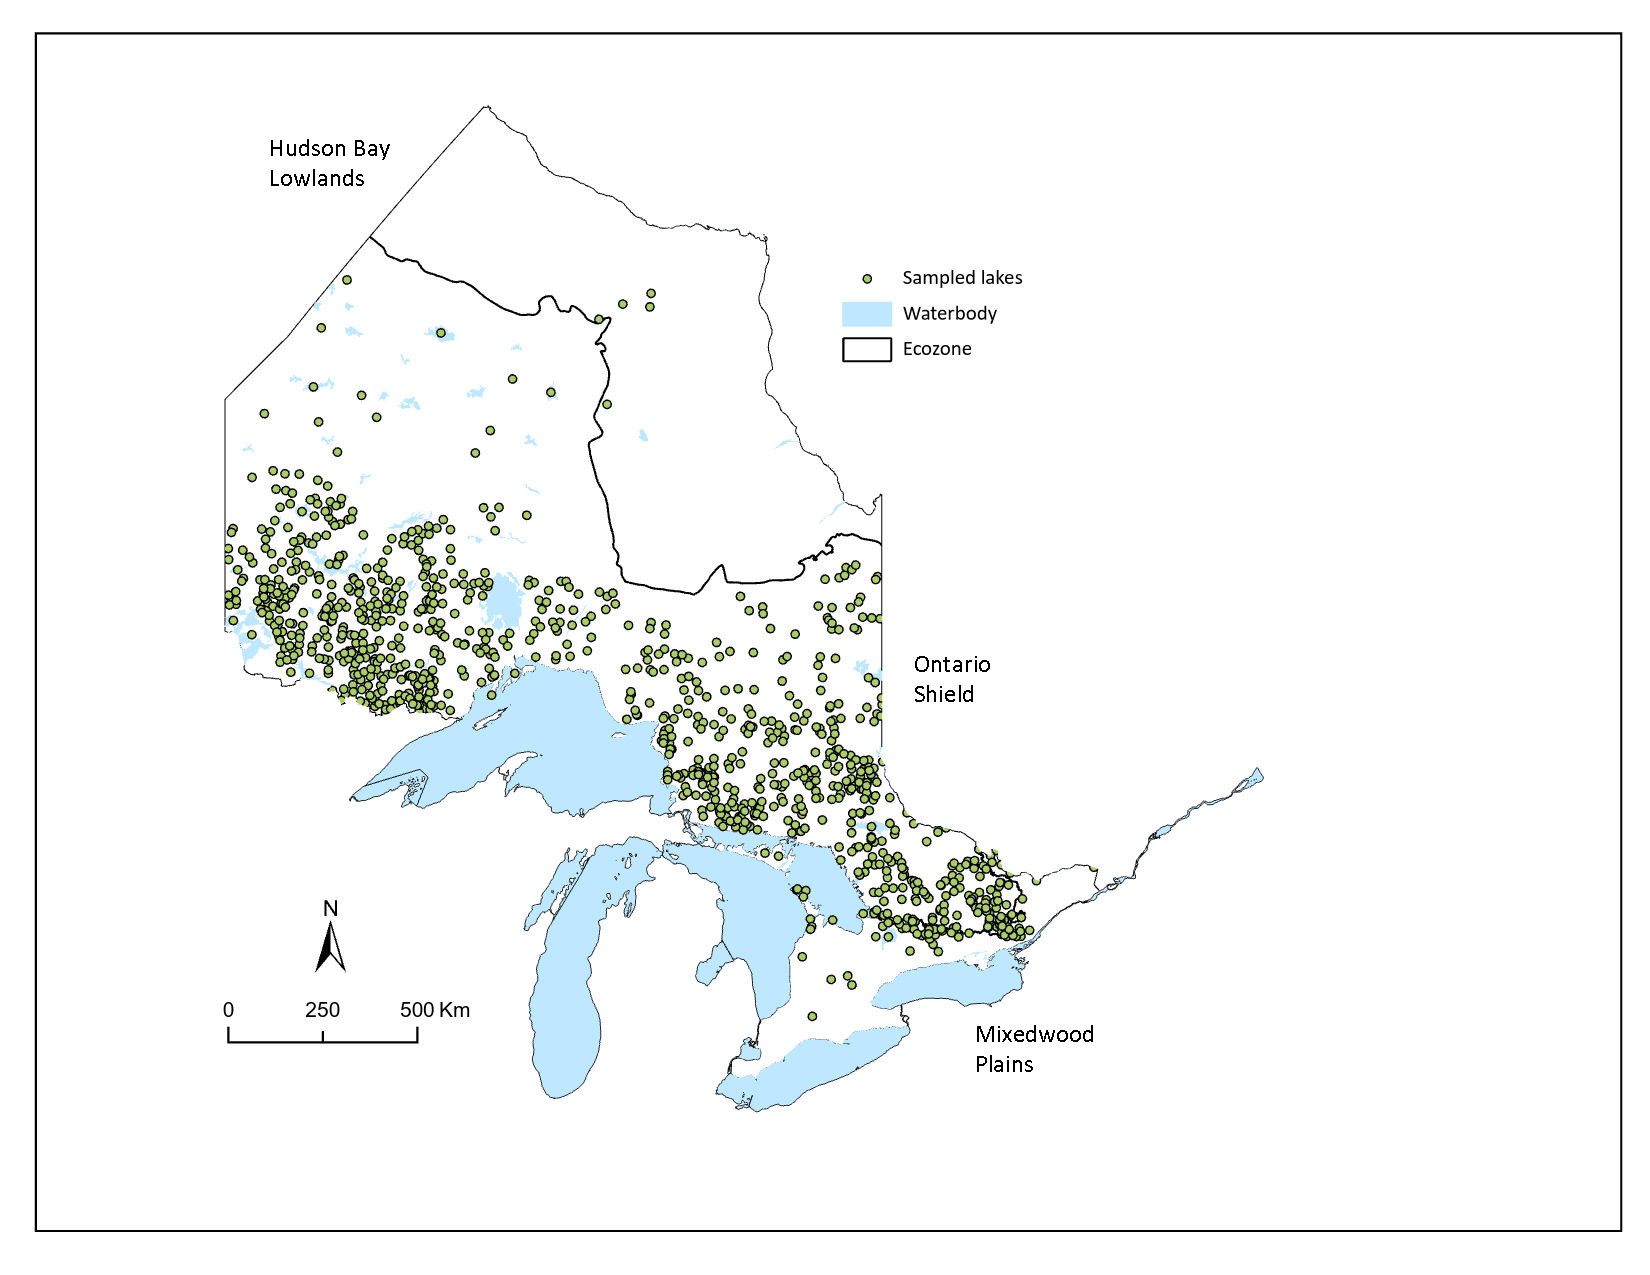
The BSM program is conducted in 5-year intervals; cycle 1 includes samples taken between 2008-2012, cycle 2 includes samples taken from 2013-2017, and cycle 3 includes data from samples taken between 2018-2024 (longer time-span due to delays in field work during covid). The sampled lakes include only those between 5 and 250,000 hectares, so numerous smaller lakes are not represented in this indicator. It is impractical to monitor all the lakes in Ontario, so a sample of lakes from each zone is selected for monitoring. Fifty hectares was chosen as the smallest lake size based on the ability to access and use sampling gear in the lake, while 250,000 hectares was the largest because lakes larger than this are already intensively monitored by the ministry (MNR 2024).
Based on data from the BSM program (MNR 2025) a total of 765 lakes were included in cycle 1, 729 were included in cycle 2 and 467 were included in cycle 3 for this indicator. A total of 333 of those sampled in cycle 1 were also sampled in the following 2 cycles (Table 2).
In each cycle, most sampled lakes were found in the Ontario Shield ecozone, the lakes within the Mixedwood Plains were sampled in smaller numbers, and lakes within the Hudson Bay Lowlands ecozone were sampled in cycle 1, and not in cycle 2 or cycle 3.
Table 2. Number of lakes sample by the BSM program per cycle(MNR 2025).
| Ecozone |
Sampled during cycle 1 |
Sampled during cycle 2 |
Sampled during cycle 3 |
Sampled in cycle 1, 2 and 3 |
| Ontario Shield |
709 |
680 |
419 |
300 |
| Mixedwood Plains |
51 |
49 |
48 |
33 |
| Hudson Bay Lowlands |
5 |
0 |
0 |
0 |
| Total |
765 |
729 |
467 |
333 |
The status of lakes for each water quality parameter – calcium, pH, and total phosphorus – showing their status with respect to threshold levels are summarized by ecozone (Figures 2, 3 and 4).
It is important to note that some lakes may naturally have water quality values that are beyond the threshold levels that can have impacts on biodiversity (e.g., low pH, high phosphorus). It will be important to assess the trends in these key water quality parameters as successive 5-year cycles of the Broad-Scale Monitoring Program are completed. Additional information on the water quality of Ontario’s inland lakes is available from sampling conducted by the Ministry of the Environment, Conservation and Parks and its Lake Partner Program, as well as the Ontario Geological Survey. For information on a more regional scale, there are other intensive lake water quality monitoring programs that are undertaken continuously within regions for 5-10 years, including the Muskoka Watershed Council, Kawartha Lakes Stewards Association, Haliburton U-Links and Conservation Authorities with lakes, such as Otonabee Conservation and Kawartha Conservation, and more. The Great lakes have been monitored for decades as well.
Related Theme(s)
Web Links
Government of Canada – Canada-United States Air Quality Agreement: overview – Canada.ca
Lake Partner Program, Data catalogue – https://data.ontario.ca/dataset/ontario-lake-partner
Ontario Geological Survey data https://www.ontario.ca/page/ontario-geological-survey
Ontario Ministry of Environment Conservation and Parks, Total Phosphorus report – https://www.ontario.ca/page/total-phosphorus-report?id=71010001
Ontario Ministry of Natural Resources – Ontario’s Broad Scale Monitoring Program – https://www.ontario.ca/page/broad-scale-monitoring-program
References
Cox, E.T. 1978. Counts and measurements of Ontario lakes. Ontario Ministry of Natural Resources, Toronto, ON.
Environment and Climate Change Canada (2025) Canadian Environmental Sustainability Indicators: Phosphorus levels in the offshore waters of the Great Lakes. Consulted on March 3, 2025.
Ingram, R. G., R. E. Girard, A. M. Paterson, P. Sutey, D. Evans, R. Xu, J. Rusak, C. Thomson, and C. Masters. 2013. Dorset Environmental Science Centre: lake sampling methods. Ontario Ministry of the Environment, Dorset, ON.
Jeziorski, A., and 14 co-authors. 2008. The widespread threat of calcium decline in freshwaters. Science 322:1374-1377
Ministry of Environment and Energy (MOEE). 1994. Water management policies, guidelines and provincial water quality objectives of the Ministry of Environment and Energy. Queen’s Printer for Ontario, Toronto, ON. [Available at: http://www.ontario.ca/document/water-management-policies- guidelines-provincial-water-quality-objectives]
Neary B.P., and J.H. Leach. 1992. Mapping the potential spread of the zebra mussel (Dreissena polymorpha) in Ontario. Canadian Journal of Fisheries and Aquatic Sciences 49:406–15.
Ontario Ministry of the Environment. 1979. Rationale for the establishment of Ontario’s Provincial Water Quality Objectives. Queen’s Printer for Ontario. 236 p.
Ontario Ministry of the Environment (OMOE). 2013. Water quality in Ontario: 2012 report. Queen’s Printer for Ontario, Toronto, ON. [Available at: https://www.ontario.ca/environment-and- energy/water-quality-ontario-report-2012].
W Keller, S S Dixit, and J Heneberry. 2001. Calcium declines in northeastern Ontario lakes. Canadian Journal of Fisheries and Aquatic Sciences. 58(10): 2011-2020. https://doi.org/10.1139/f01-142