
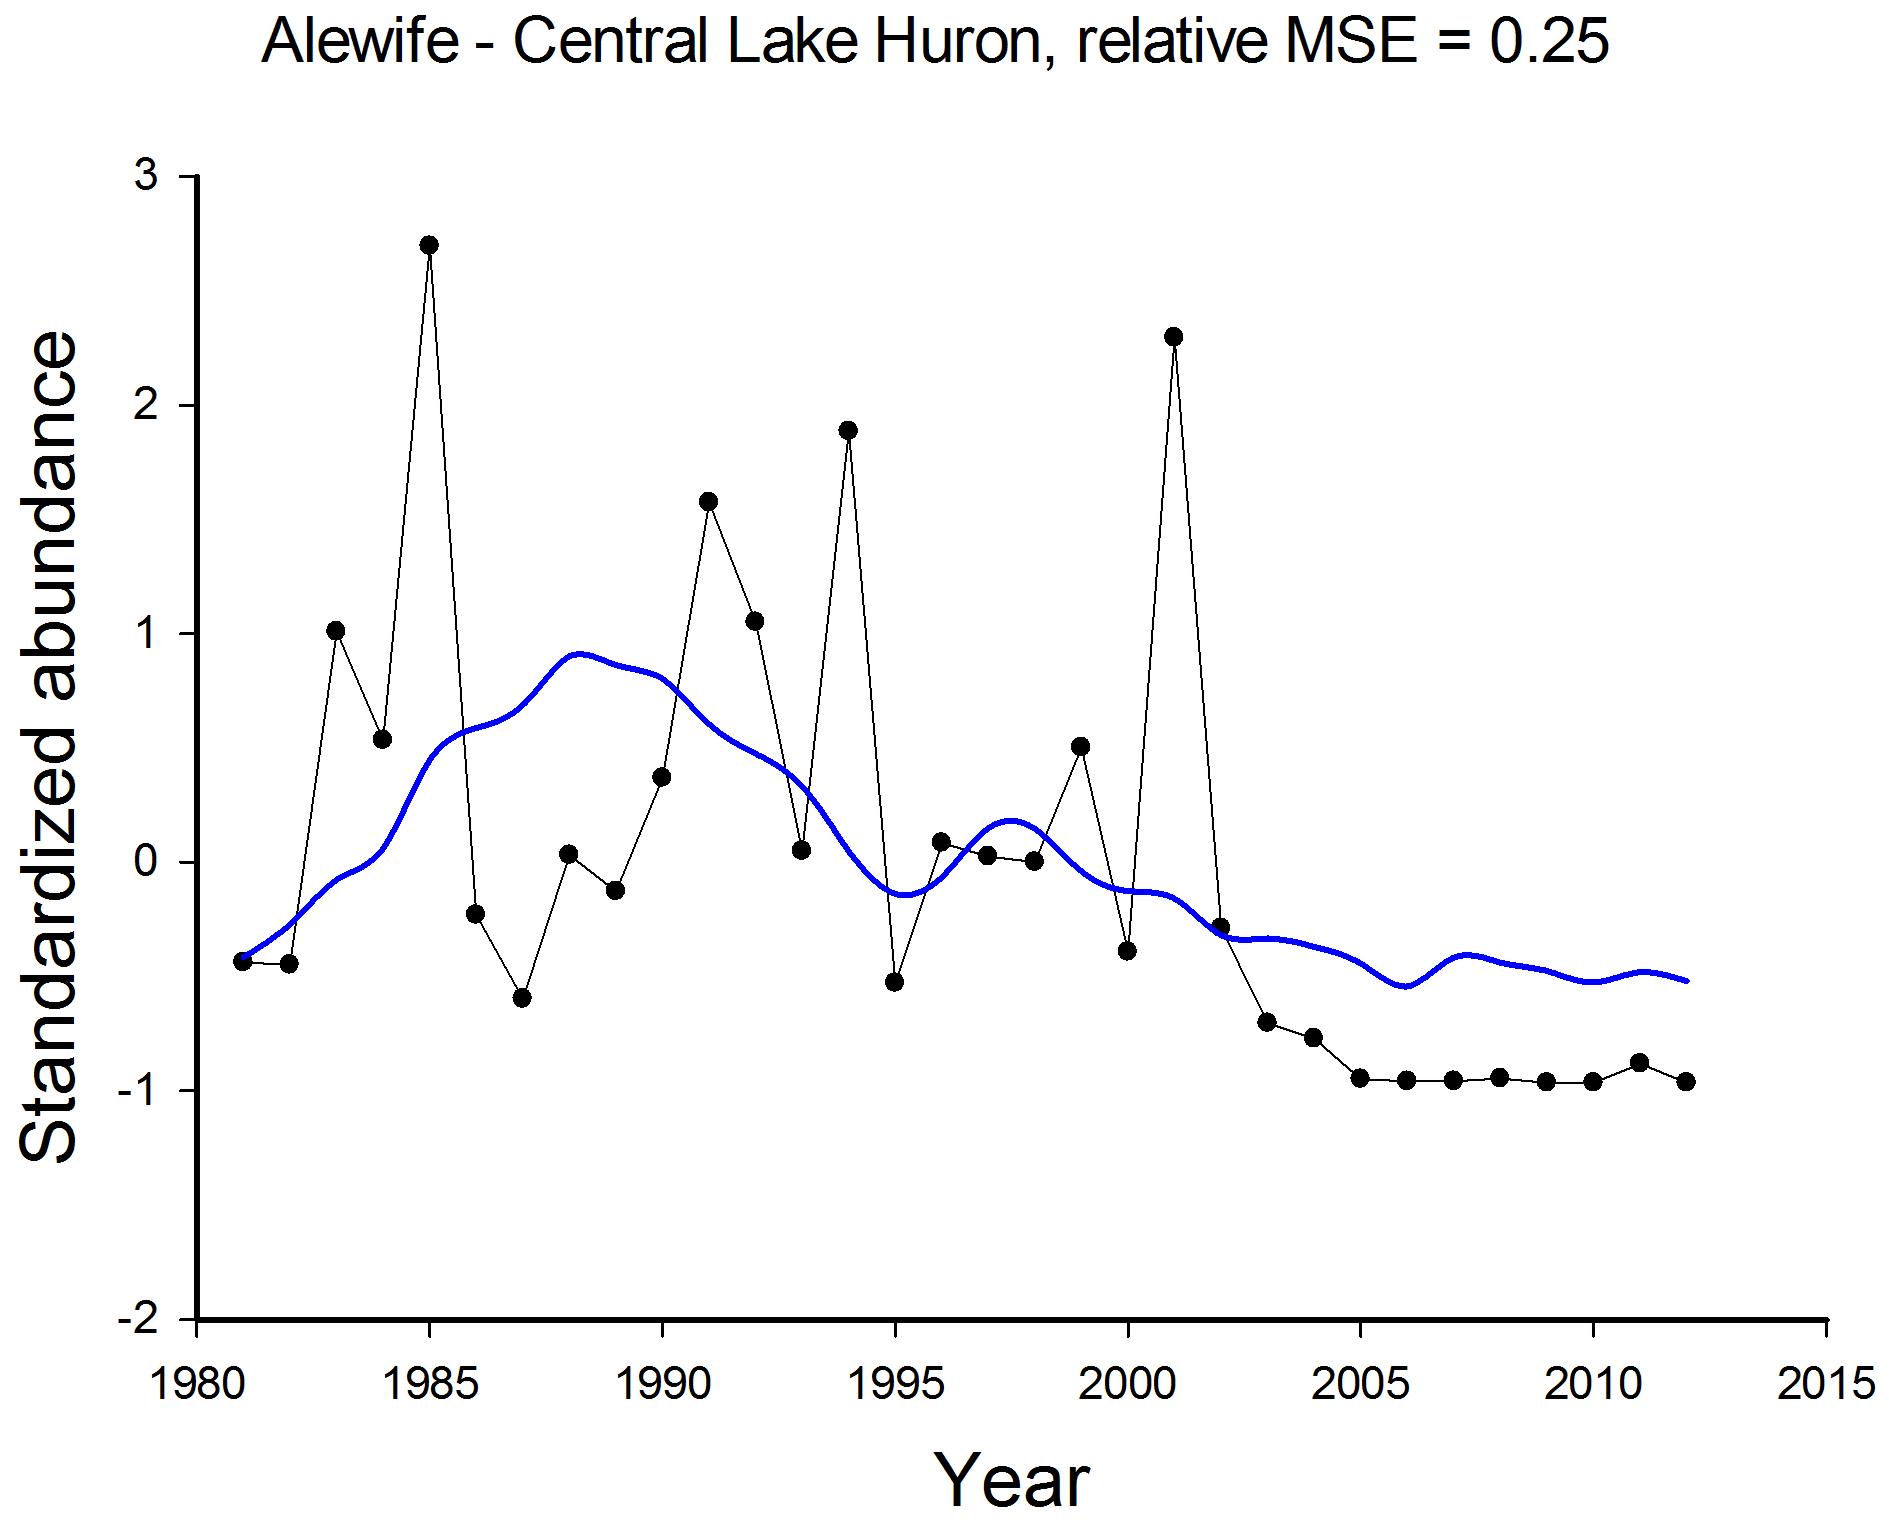
Figure 2. Observed (black dots and line) and predicted (blue line) temporal trends in standardized relative abundances of Alewife in Central Lake Huron based on dynamic factor analysis of standardized gillnet Catch Per Effort data.
Figure 2. Observed (black dots and line) and predicted (blue line) temporal trends in standardized relative abundances of Alewife in Central Lake Huron based on dynamic factor analysis of standardized gillnet Catch Per Effort data.