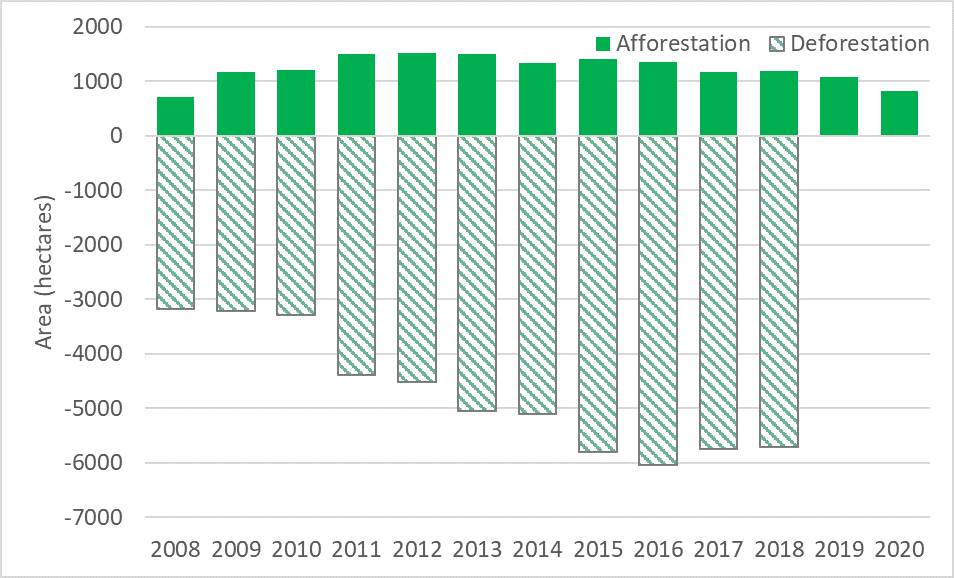
Figure 1. Trends in areas of afforestation from 2008–2020 (positive values) and deforestation from 2002–2018 (negative values) in hectares across Ontario (MNDMNRF 2021, Forests Ontario 2021). Note: deforestation data is not yet available after 2018.

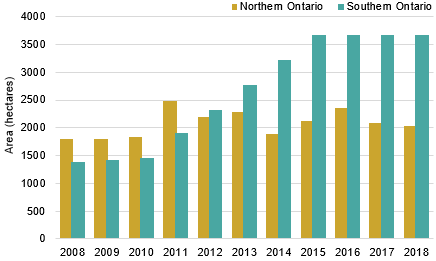
Figure 2. Area deforested in hectares from 2008–2018 in northern and southern Ontario (MNDMNRF 2021).

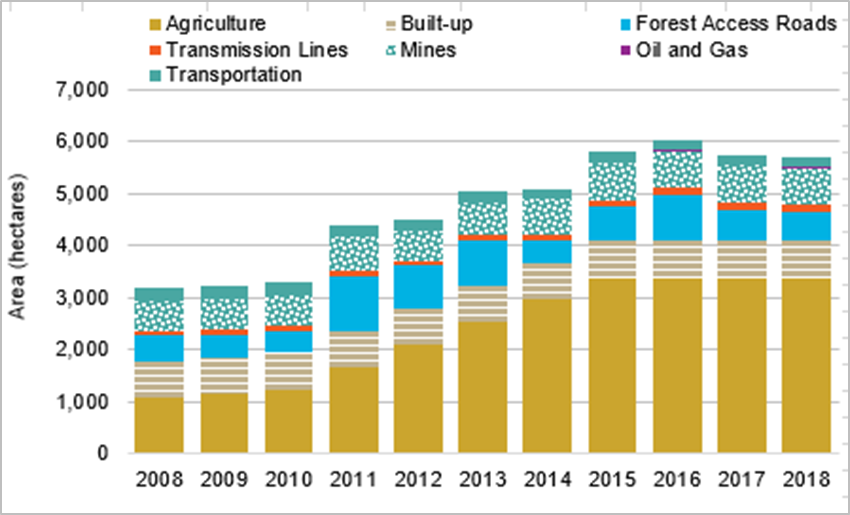
Figure 3. Area deforested in hectares across Ontario by industrial sector from 2008-2018 (MNDMNRF 2021).

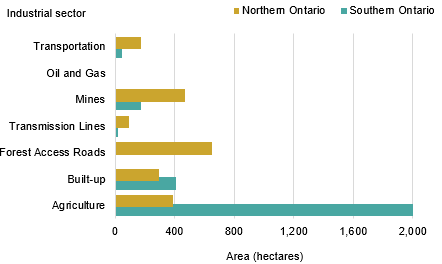
Figure 4. Average annual area deforested from 2008–2018 in northern and southern Ontario by industrial sector (MNDMNRF 2021)
Status:
- Afforestation rates have remained relatively constant from 2008 to 2018. Although the annual area deforested in the province is small relative to the total amount of forest, overall deforestation saw an increase between 2008 and 2016, driven largely by agriculture in southern Ontario (MNDMNRF 2021). Deforestation declined slightly between 2016 and 2018, mirroring trends from across the country.
- During that same time period deforestation in Northern Ontario remained relatively stable (averaging 2,079 ha/year), while it increased in southern Ontario (averaging 2,652 ha/year, an increase from 1,382 hectares in 2008 to 3,674 in 2018).
- An average of 1,276 hectares of forest was gained per year through afforestation compared to an average of 4,731 ha per year lost to deforestation (MNDMNRF 2021).
- A total of 14,038 ha of new forest was established through afforestation while 52,041 ha was lost through deforestation (MNDMNRF 2021).
- There was a net loss of 38,003 hectares of forest or 0.05% of Ontario’s total forest area (MNDMNRF 2021).
Previous version: Afforestation and deforestation – 2015
Our climate is already changing due to human influences (IPCC, 2021) and demonstrated impacts to biodiversity from climate change are being documented throughout the globe (IPBES 2019), including Ontario (e.g. Kennedy-Slaney et al. 2018; Mayor et al. 2017, Youngflesh et al. 2021, Marrotte et al. 2020). Fortunately, the conservation of biodiversity can play an important role in mitigating climate change and adapting to its inevitable effects. For example, ecosystems such as forests, grasslands and wetlands are important carbon sinks that help reduce greenhouse gas emissions. Ontario’s forests store 7.2 billion tonnes of carbon (MNDMNRF 2021). It is estimated that non-treed peatlands in Ontario’s Far North store 36 billion tonnes of carbon (McLaughlin and Webster 2013). The protection and sustainable management of forests, grasslands and wetlands, effectively managing and expanding protected area networks, afforestation (planting trees on currently non-forested land) and wetland and grassland restoration can all play a role in climate change mitigation and increasing ecosystem resilience to a changing climate (IPBES 2019). There is a need to both protect and enhance carbon sinks while we also reduce carbon sources (anthropogenic-caused greenhouse gas emissions).
Afforestation (planting trees in areas that have been historically forested, or capable of returning to forest), or tree planting, is an important component to mitigating climate change as it can increase the amount of carbon stored in trees and soils, while providing native habitat and enhancing resilience for forest-dependent biodiversity. Tree planting initiatives such as the 50 Million Tree Program led by Forests Ontario and other emerging programs, such as the federal 2 billion tree program, support landowners to plant trees on their land, in collaboration with partners such as conservation authorities, stewardship councils and municipalities. As of 2020, Forests Ontario had planted more than 30 million trees through the program, producing over 16,500 hectares of new forest (Forests Ontario 2021).
While recognizing the importance of afforestation efforts to climate change mitigation through the sequestration and storage of carbon, deforestation (permanent conversion of forested land to other uses such as roads, urban development and agriculture) is also important to consider.
Forest harvest and renewal is not considered deforestation as the forest is re-established post-harvest and the land use is not changed. Forest harvesting does impact both ground carbon storage and soil carbon storage however changes to forest due to harvesting is not included in this indicator report. Further data on forest harvest and other disturbances are included in the forest cover and disturbance indicator report. Deforestation results in the release of carbon and diminishes the ability of ecosystems to remove carbon dioxide from the atmosphere and store carbon on the landscape. International climate change agreements require reporting for carbon sequestration due to afforestation and carbon emissions due to deforestation. Many countries, including Canada, are also accounting for these emissions and removals towards their climate change targets. Canada monitors, reports, and accounts for changes in carbon stocks from afforestation, reforestation and deforestation activities that have occurred since 1990 (NRCAN 2020).
This indicator examines trends from 2008–2020 in the annual area of land in Ontario that has been afforested, compared with the area that has been deforested.
Afforestation
Afforestation was estimated as the area of land converted to forest on private lands by using tree planting records from Forests Ontario through the 50 Million Tree Program. Forests Ontario has been tracking afforestation activities under the 50 Million Tree Program since 2008. At each planting location, the area afforested (ha) and a variety of other information, including the number and species of trees planted, is recorded. The data is updated yearly for each planting season. Forest gained from natural sources, such as the transition of old fields to forest, is not included.
The vast majority of planting projects have occurred in the Mixedwood Plains Ecozone (southern Ontario) but there have also been afforestation efforts in ecodistricts on the southern edge of the Ontario Shield Ecozone.
The 50 Million Tree data was analyzed to summarize the annual area afforested based on area planted with trees (shrubs were removed) and a single entry per planting location.
The information presented for this indicator represents a summary of the forest afforestation and deforestation indicator from the State of Ontario’s Natural Resources: Forest 2021 report (MNDMNRF 2021).
Deforestation
Data on deforestation were derived from multiple sources:
- data from Canada’s National Deforestation Monitoring System that uses satellite imagery to identify conversion of forest to other land uses
- MNRF data of forest cleared to construct permanent forest access roads
Data from the National Deforestation Monitoring System is supplemented with provincial data to capture the extent of permanent forest access roads narrower than 20 meters. Permanent forest access roads include primary and branch roads. Primary roads provide principal access to an area where forest management takes place. Branch roads provide access to, through or between areas of forest management operations. Temporary forest access roads, called operational roads, are not included in the estimate of deforestation. Estimates of afforestation and deforestation do not include the Far North as there is still a lack of data for this area. This indicator cannot be readily compared to previous reports because of the revised data sources and methods used and therefore earlier SOBR reports with data from the early 1990s has been removed for this indicator report (MNDMNRF 2021).
Annual data on deforestation in southern and northern Ontario and data on afforestation were combined into a sngle graph to compare forest gains and losses over the period 2008–2020 (Figure 1). Annual areas deforested in hectares from 2008–2018 in Northern Ontario compared to southern Ontario are illustrated in Figure 2. To understand the reasons for the changes to forested areas, Figure 3 outlines the area deforested in hectares across Ontario by the industrial sector. Figure 4 further outlines the differences between reasons for deforestation in southern and northern Ontario by industrial sectors.
Related Themes:
Pressures on Biodiversity – Habitat Loss
Web Links:
Ontario Ministry of Natural Resources – Forestry https://www.ontario.ca/rural-and-north/forestry
Forests Ontario – 50 Million Tree Program http://www.forestsontario.ca/index.php/50mtp
Forests Ontario – 2019-2020 annual report https://downloads.ctfassets.net/e09p19lzfrfe/2nKifi7w8SeqVLylC7QAua/576c09fdfccf3ca2acf6681dce88f123/FO20-21_ANNUAL_REPORT_4WEB_FA-FINAL.pdf
Government of Canada – Inventory and Land-use change https://www.nrcan.gc.ca/climate-change/impacts-adaptations/climate-change-impacts-forests/carbon-accounting/inventory-and-land-use-change/13111
References:
Chen Jiaxin, Ter-Mikaelian Michael T., Ng Peter Q., and Colombo Stephen J. Ontario’s managed forests and harvested wood products contribute to greenhouse gas mitigation from 2020 to 2100. The Forestry Chronicle. 94(03): 269-282. DOI:10.5558/tfc2018-040 (pubs.cif-ifc.org/doi/abs/10.5558/tfc2018-040)
Forestry Chronicle – Growing our future https://assets.ctfassets.net/e09p19lzfrfe/WPfzgqACNQb5XWMvQkq7m/dae8c66deb35a0f78627d6790f5a0eb2/Forestry_Chronicle_-_Growing_our_future_-_Assessing_the_outcome_of_afforestation_programs_in_ON__Canada.pdf
IPBES (2019): Global assessment report on biodiversity and ecosystem services of the Intergovernmental Science-Policy Platform on Biodiversity and Ecosystem Services. E. S. Brondizio, J. Settele, S. Díaz, and H. T. Ngo (editors). IPBES secretariat, Bonn, Germany. 1148 pages.[available at: https://doi.org/10.5281/zenodo.3831673]
McLaughlin, J., and K. Webster. 2013. Effects of a changing climate on peatlands in permafrost zones: a literature review and application to Ontario’s Far North. Ontario Ministry of Natural Resources Climate Change Research Report CCRR-34. Queen’s Printer for Ontario, Sault Ste. Marie, ON.
Natural Resources Canada, Canadian Forest Service, National Deforestation Monitoring System, special tabulation of data from NDMS: DD2021–R05f. December 16, 2020.
Ontario Ministry of Natural Resources (OMNR). 2008. Southern Ontario Land Resource Information System (SOLRIS) Phase 2 – Data Specifications Version 1.2. Ontario Ministry of Natural Resources, Peterborough, ON.
Ontario Ministry of Northern Development, Mines, Natural Resources and Forestry, 2021. State of Ontario’s Natural Resources – Forests 2021. Queen’s Printer for Ontario, Sault Ste. Maire, ON. [Available at: https://www.ontario.ca/page/state-ontarios-natural-resources-forest-2021]
Secretariat of the Convention on Biological Diversity (SCBD). 2010. Connecting biodiversity and climate change mitigation and adaptation. Secretariat of the Convention on Biological Diversity, Montreal, QC. [Available at: http://www.cbd.int/doc/publications/ahteg-brochure-en.pdf]
Genetic diversity — or the variation in genes in a species or population — is a fundamental source of biodiversity. For forests, it provides a basis for tree adaptation and resilience to environmental stress, pests, and diseases and contributes to community dynamics and ecosystem functioning (FAO 2015; Shaw et al. 2025). Human-caused disturbances such as greenhouse gases, landscape fragmentation, invasive species spread, and air and soil pollution affect how genes move and change, or even lo…
Read MoreThe government of Ontario’s 50 Million Tree Program was established in 2007 to re-green settled landscapes, with a pledge to plant 50 million trees across the province by 2025. The primary purpose of the program is to sequester approximately 6.6 million tonnes of carbon dioxide by 2050, helping southern Ontario’s forests withstand the effects of climate change. Other benefits include improving wildlife habitat, contributing to soil and water conservation efforts, moderating local climate and…
Read More


