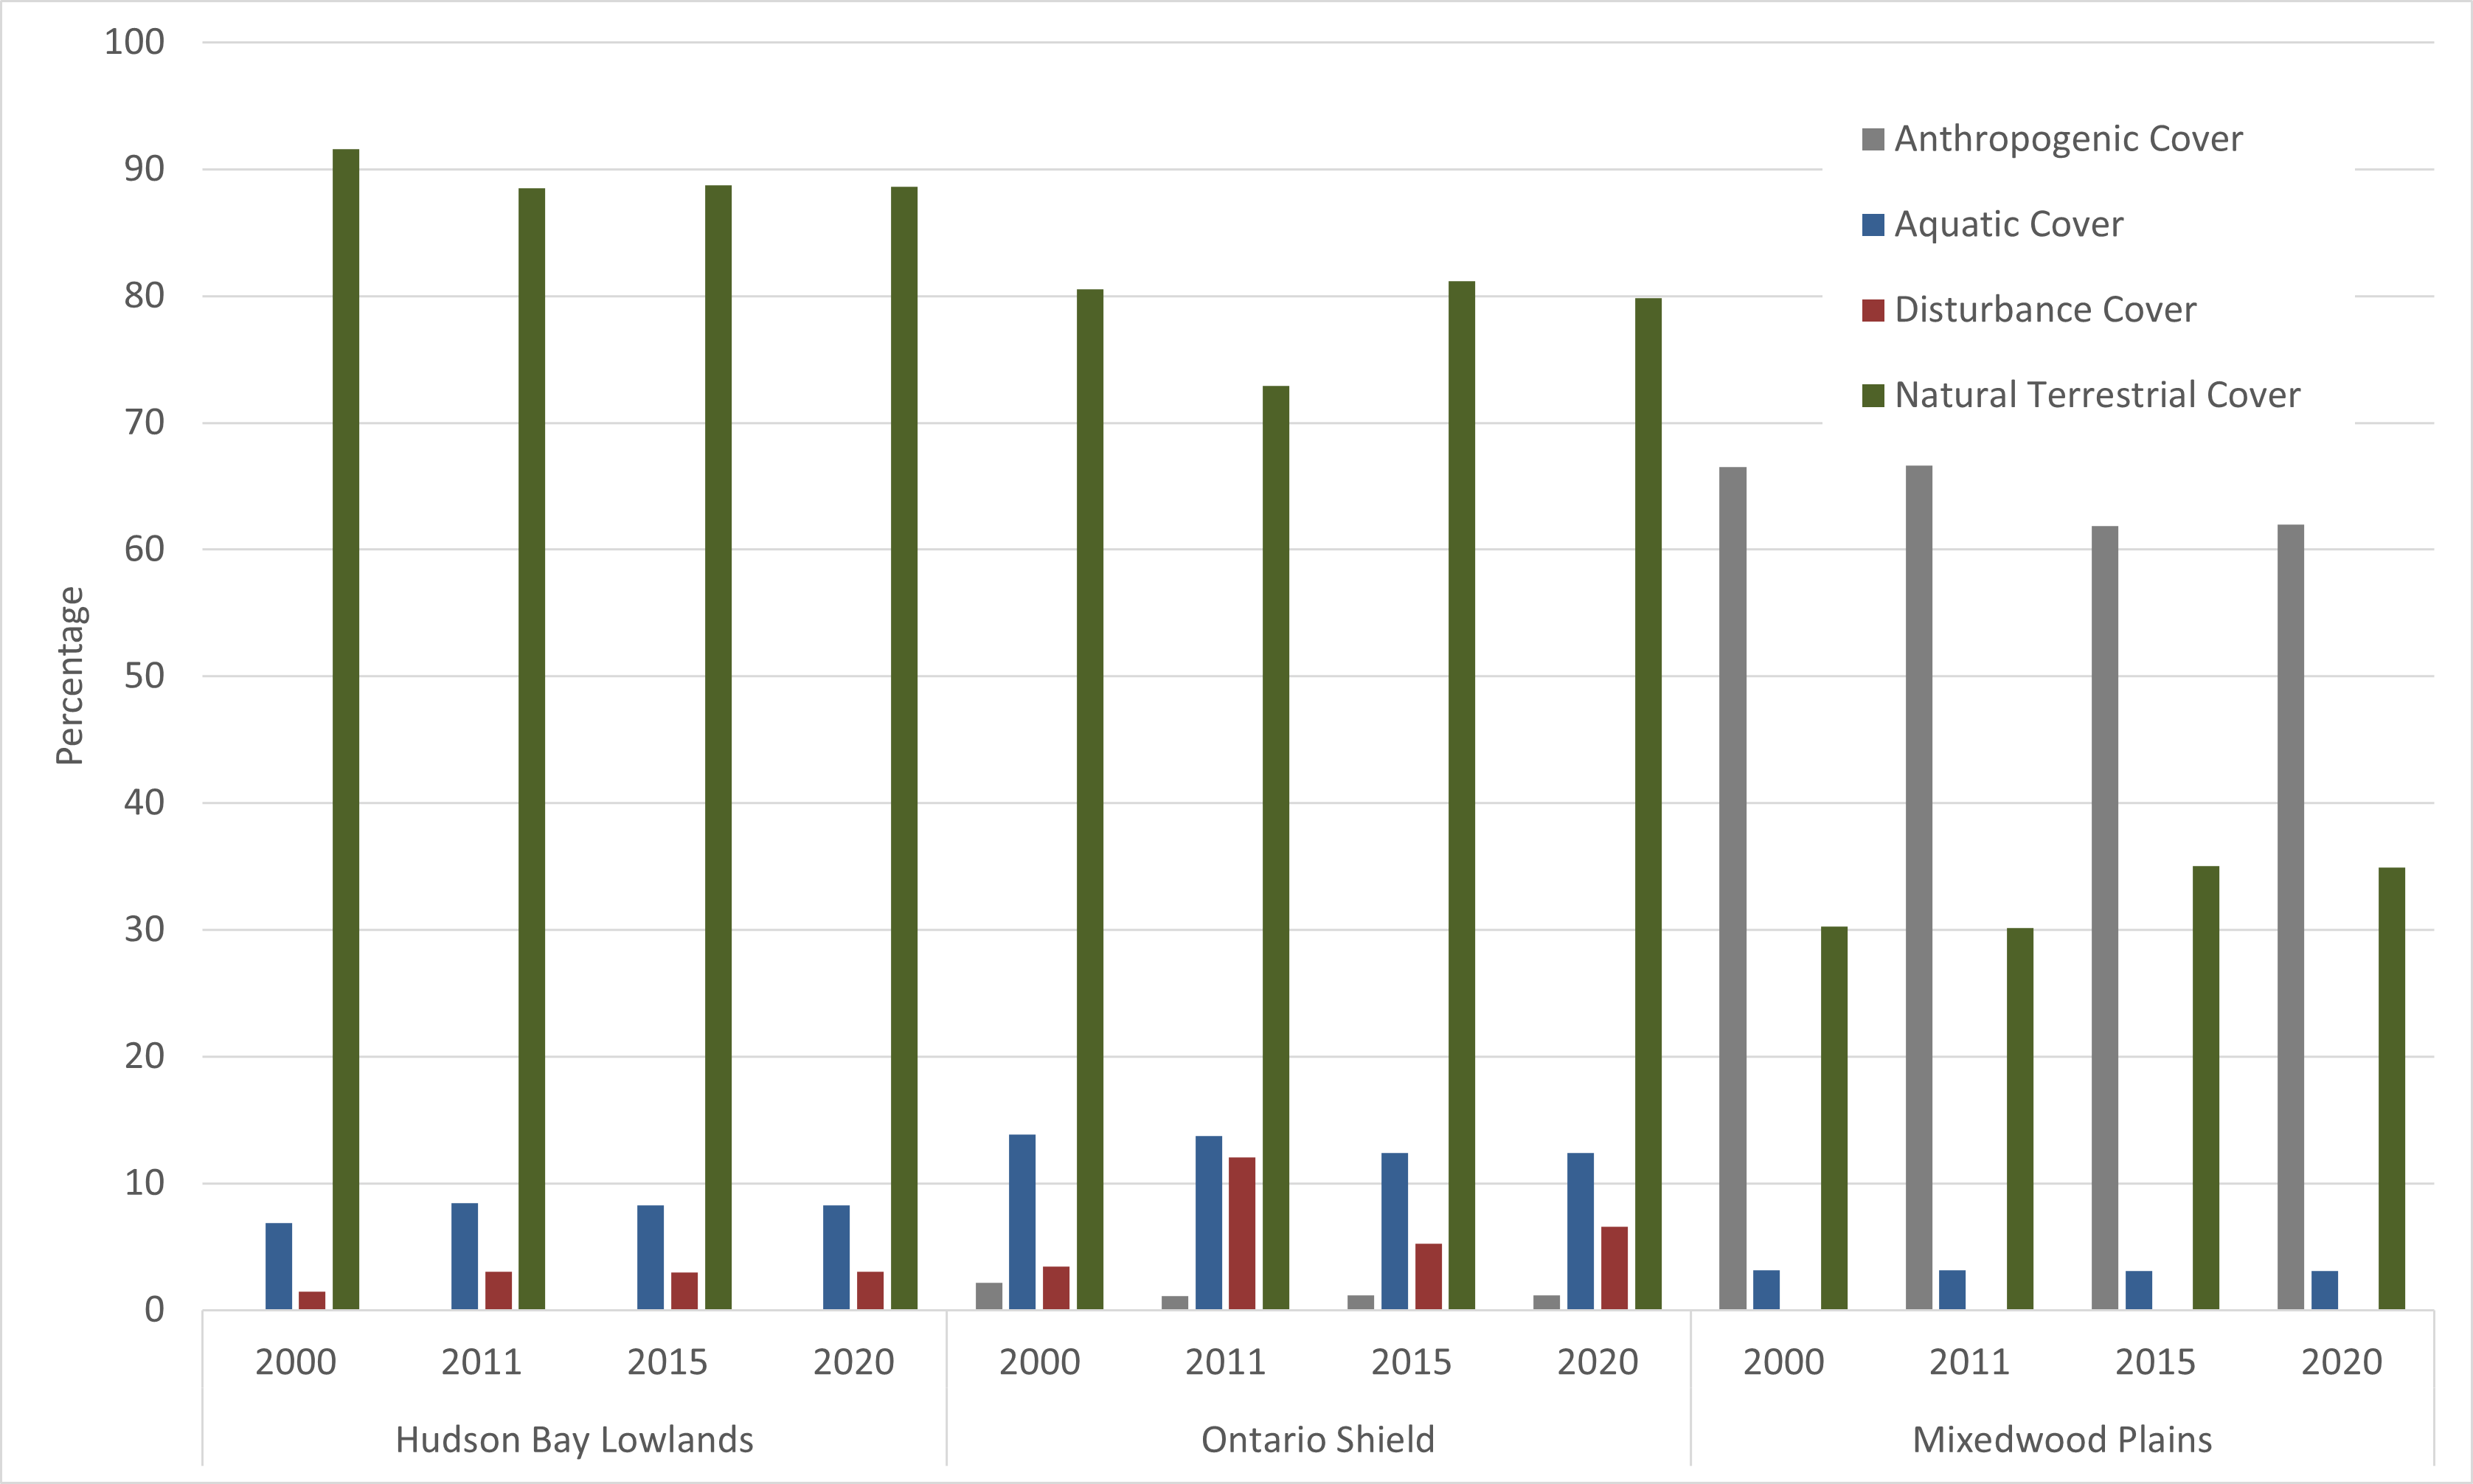
Figure 2. Comparison of percentage land cover composition for Ontario’s ecozones based on land cover current to 2000, 2011, 2015, and 2020.
Note: totals may not sum to 100% because of areas not being classified due to cloud cover.
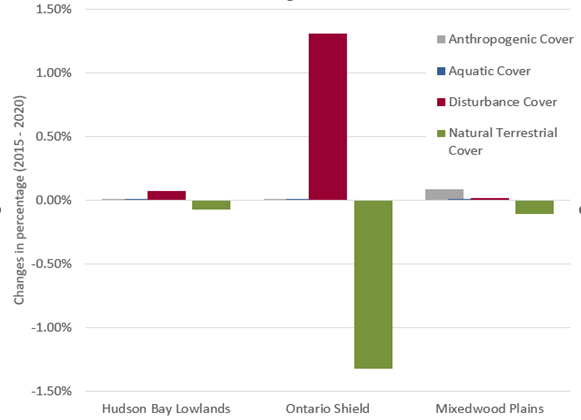
Figure 3. Changes in the percentage of land cover composition by ecozone 2015-2020. (OLC v1, 2024)
Table 2 . Total hectares of area categorized in broad land cover classes for ecozones in 2015 and 2020.
|
2015 Hudson Bay Lowlands |
2020 Hudson Bay Lowlands |
2015 Ontario Shield |
2020 Ontario Shield |
2015 Mixedwood Plains |
2020 Mixedwood Plains |
| Anthropogenic Cover (ha) |
2,404.67 |
2,407.27 |
763,789.48 |
772,336.15 |
5,285,007.31 |
5,292,243.80 |
| Aquatic Cover (ha) |
2,052,436.28 |
2,052,910.11 |
8,094,180.19 |
8,098,481.58 |
265,783.39 |
266,003.93 |
| Disturbance Cover (ha) – combined with natural disturbance cover in 2015 |
731,346.37 |
749,134.89 |
3,436,414.58 |
4,291,409.48 |
827.57 |
2,498.40 |
| Natural Terrestrial Cover (ha) |
22,007,170.40 |
21,988,905.43 |
53,059,427.37 |
52,191,624.85 |
2,990,962.69 |
2,981,830.78 |
| Ecozone Area (ha) |
24,793,357.71 |
24,793,357.7 |
65,353,811.63 |
65,353,852.05 |
8,542,580.96 |
8,542,576.91 |
Status:
- In 2020, 61.9% of the Mixedwood Plains ecozone was categorized as anthropogenic cover, the highest percentage of all the ecozones, this is the same as in 2015. Agriculture accounts for most of the anthropogenic cover in the Mixedwood Plains ecozone. In the Ontario Shield ecozone, anthropogenic cover remains low at 1.18% of the ecozone, similar to previous reports, and the Hudson Bay Lowlands ecozone has the least amount of anthropogenic cover at 0.01%, this number has not changed since the 2011 assessment.
- In 2020, disturbance cover (fire, harvest, insect, etc.) in the Ontario Shield ecozone represented 6.57% of the land cover. In the Hudson Bay Lowlands ecozone it was at 3.02%, and 0.03% in the Mixedwood Plains ecozone.
- The Hudson Bay Lowlands ecozone has the most natural terrestrial cover with 88.65% of the ecozone, Ontario Shield has 80% and the Mixedwood Plains has 34% natural cover.
- The Ontario Shield has the most amount of aquatic cover than any of the ecozones with 12%.
- The vast majority of the Hudson Bay Lowlands and the Ontario Shield (both at 99%) ecozones remain in natural land cover types (aquatic, natural terrestrial and disturbance).
- Change between 2015 and 2020 in the Mixedwood Plains ecozone, included a slight increase in anthropogenic cover (0.08%) with a corresponding decrease of natural terrestrial cover (-0.11%). The amount of change due to disturbances (fire, insects, forest harvests etc.) remained extremely low for this ecozone at 0.02%, while the aquatic cover did not change.
- Between 2015 and 2020, the Ontario Shield ecozone saw a decrease of 1.33% of natural terrestrial cover and an increase of 1.31% of disturbance. Aquatic cover and anthropogenic cover remained relatively the same with a 0.01% increase.
- The Hudson Bay Lowlands saw the least amount of change in all cover classes; no change in anthropogenic or aquatic, and a slight increase in disturbance 0.07% which correlated with a decrease in natural cover 0.07%.
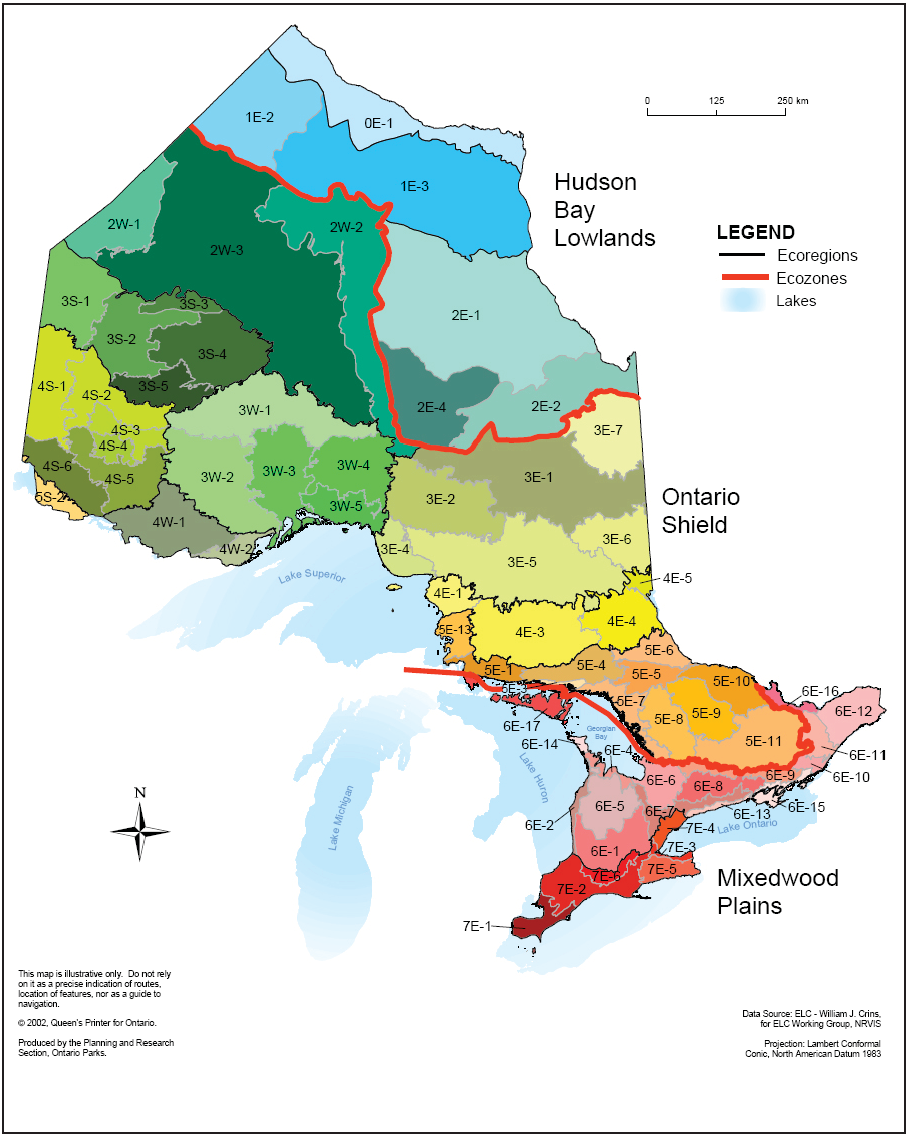
Figure 1. The ecozones, ecoregions, and ecodistricts of Ontario (MNRF 2009)
Classes of land cover from digital provincial data sets were aggregated into four broad land cover categories (Table 1). Ontario land cover information from the Ontario Land Cover version 1 (OLC v.1 v.1, 2024) was used to identify and measure land cover by category throughout the province for 2020 and 2015.
In the earlier version of the indicator (SOBR 2015) land cover in 2000 and 2011 were assessed by using 3 different land cover products together to cover the entire province, they included the Far North Land Cover 1.4 (FNLC 2014; OMNRF 2014), the Provincial Land Cover 2000 (PLC2000; Spectranalysis Inc. 2004) and SOLRIS (OMNR 2008). Data from PLC2000 were used to assess land cover in the year 2000. The 2011 information was assessed using the FNLC which included the entire Hudson Bay Lowlands ecozone and the northern portion of the Ontario Shield ecozone and an update to the rest of the PLC2000 that was incorporated into spatial information maintained by the OMNR on forest harvest, forest regeneration and burns.
Table 1. Broad land cover types used in analysis.
| Broad land cover type |
Land cover classes included |
| Anthropogenic cover |
Built-up/settlement areas, roads, agriculture, and extraction (stone, sand and gravel, mines) |
| Aquatic cover |
Open water of lakes and streams |
| Disturbance cover* |
Forest harvested within the previous 5-year period, forests with recent burns, insect damage or blowdown |
| Natural terrestrial cover |
Alvars, mudflats, prairies, savannahs, meadows, wetlands, forests, rock, open bedrock, marsh and other open country habitat |
*Previously reported as 2 separate categories — Disturbance cover and natural disturbance cover are no longer separated as it is difficult to distinguish the difference between a natural disturbance such as burns and insect damage and forest harvest.
The trends in the proportion of broad land cover types in each of Ontario’s ecozones over the period 2000–2020 are compared to assess for changes (Figure 2), as well as the changes of land cover types across the province between 2015 and 2020 (Figure 3).
Comparing land cover information through time using different datasets presents challenges. It may be difficult to determine if observed changes are related to real changes on the landscape or are related to differences in the accuracy and classification methods used. To address this concern land cover classes are grouped into larger broad land cover types (see Table 1). For example, the same area might be assigned to a forest class or a treed wetland class using different classification methods – these two classifications would be considered natural terrestrial cover in this analysis.
Related Theme(s)
Related Target(s)
Web Links:
Ontario GeoHub – Ontario Land Cover Version 1.0 –https://geohub.lio.gov.on.ca/documents/667367a759214a089917adccdbae7cb2/about
References
Ontario Ministry of Natural Resources and Forestry (OMNRF). 2019. Southern Ontario Land Resource Information System (SOLRIS) 3.0 – Ontario Ministry of Natural Resources and Forestry, Peterborough, ON.
Ontario Biodiversity Council. 2015. State of Ontario’s Biodiversity. Ontario Biodiversity Council, Peterborough, Ontario [Available at: www.sobr.ca].
Ontario Biodiversity Council. 2021. State of Ontario’s Biodiversity. Ontario Biodiversity Council, Peterborough, Ontario [Available at: www.sobr.ca].
Ontario Ministry of Finance. 2018. Ontario population projections update. Queen’s Printer for Ontario, Toronto.
Ontario Ministry of Natural Resources and Forestry (OMNRF). 2014. Far North Land Cover – Data Specifications Version 1.4. Ontario Ministry of Natural Resources and Forestry, Peterborough, ON.
Spectranalysis Inc. 2004. Introduction to the Ontario land cover data base, second edition (2000): outline of production methodology and description of 27 land cover classes. Inventory, Monitoring and Assessment Section, Science and Information Branch, Ontario Ministry of Natural Resources, Peterborough, ON.
